Update 9/18/2019: As expected from the Zacks earnings surprise prediction (ESP) indicator, FDX failed to meet analysts’ consensus expectation, coming in 5.8% below the mark. The price fell sharply at the open. What does that mean for our paper trades?
Under my evolving rules for earnings plays, the shares trade after the announcement came under the same rules as my ETF-focused managed shares trades. The directional movement index (DMI) gave a sell signal at the open. I hypothetically exited for a loss four minutes after the opening bell, for $152.17, a $20.23 loss.. The DMI, below, immediately turned bearish.
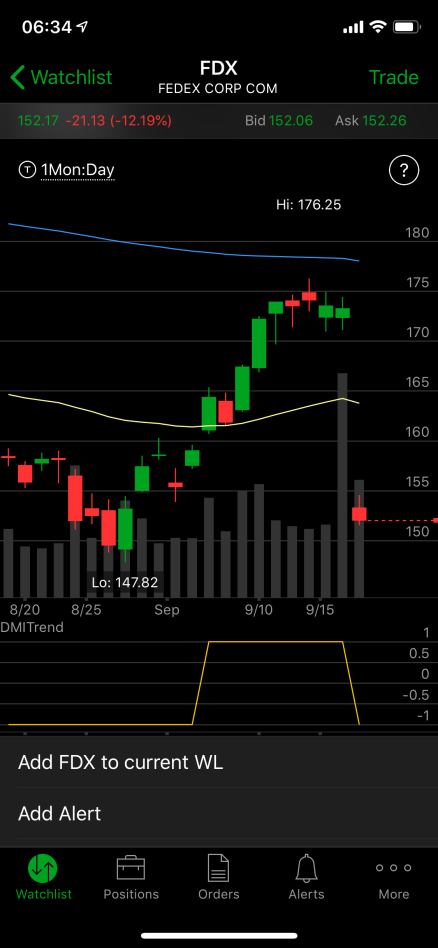
At that price, FDX stood $1.58 below the profit zone of my short bull put spread position. After the earnings announcement, the position would come under the same rules as my iron condor. The decline had placed FDX far enough out that it would take 7.65 days to return to the profit zone at the present rate of change. Therefore, the rules would mandate an exit.
In constructing the short spread I had used the same techniques as I use with my iron condors, placing the short strike at around delta 20 and the long at around delta 6. Given the magnitude of the movement, it wasn’t enough.
So I exited that paper trade as well, hypothetically four minutes after the opening bell, for $5.38, or a $4.13 loss.
Shares fell by 11.7% percent over one day, for a -4,283% annual rate. The options position produced a -76.8% loss for a -28,020% annual rate.
Bottom line: The quality of the signals used for trading matters. In this case, the Zacks ESP signal was crucial, and the Zacks rank at 3 was neutral, a sharp contrast to Morningstar’s positive assessment.
I’ll make some more paper trades, next time in alignment with all the signals, and see how things work out.
This is a PAPER TRADE, an experiment whether a strategy I have in mind will work as an earnings play. The symbol that I’ll use for this experiment is FDX, which publishes earnings after the closing bell today, Tuesday, September 17, 2019.
It’s actually two experiments. I’ll look at it both as a short bull put options spread, and also as a long shares trade. The options are leveraged, and so have the prospect of a larger win with a larger, although limited, loss. The share have no leverage, a prospect of less of a win, but also a small loss, although it can, however unlikely, result in a total loss of all that was put in the position if the price goes down to zero. As always in the markets, risk begets reward, Risk is the Mother of Profit.
A stock is a prospect for an earnings play if it meets these criteria from two separate analytical houses. I use Morningstar and require a buy rating of 50% or greater and a four star or better rating overall. I also used Zacks and require a rank of 3 or better and an expected surprise prediction (ESP) of neutral or positive (zero or greater).
Those analytical systems are just the ones I use. There’s nothing magical about them. Other analysts or even a flip of coin can work in selecting an earnings play, although the results will no doubt vary depending upon what we choose.
FDX, as it turns out, is fine on the Morningstar side: A 70% buy rating and four shiny stars. And it starts out fine on the Zacks side, with a rating of 3. However, the ESP has moved into negative territory (-1.26%), disqualifying it from a trade.
Despite FDX being set up for failure on one metric, lets try the paper trades and see how they work out.
The analysis below is for a paper trade. I put no money at risk.
I have (hypothetically) entered a short bull put spread on FDX, using options that trade for the last time 31 days hence, on October 18. The premium is a 3.34 credit and the stock at the time of entry was priced at $172.40.
The profit zone for this position is unlimited on the upside and at $151.66 on the downside.
The implied volatility rank (IVR) stands at 56%.
| Premium: | $1.25 | Expire OTM | |
| FDX-bull put spread | Strike | Odds | Delta |
| Puts | |||
| Long | 140.00 | 95.0% | 4 |
| Break-even | 153.75 | 89.0% | 10 |
| Short | 155.00 | 83.0% | 15 |
The profit zone covers a 10.8% move to the downside of the entry price.
The risk/reward ratio is 11:1, with maximum risk of $1,375 and maximum reward of $125 per contract.
And that’s the options paper trade. For the shares paper trade, I’ll use an entry debit of $172.40. I shall track both trades through their lifespans.
By Tim Bovee, Portland, Oregon, September 17, 2019
Disclaimer
Tim Bovee, Private Trader tracks the analysis and trades of a private trader for his own accounts. Nothing in this blog constitutes a recommendation to buy or sell stocks, options or any other financial instrument. The only purpose of this blog is to provide education and entertainment.
No trader is ever 100 percent successful in his or her trades. Trading in the stock and option markets is risky and uncertain. Each trader must make trading decisions for his or her own account, and take responsibility for the consequences.
License

All content on Tim Bovee, Private Trader by Timothy K. Bovee is licensed under a Creative Commons Attribution-ShareAlike 4.0 International License.
Based on a work at www.timbovee.com.

[…] posted a hypothetical trade — a paper trade — on FDX to toy with the idea of how best to do earnings plays. The truth of the stock market is that […]
LikeLike
[…] the profit zone, meaning it can be expected to be profitable at expiration. I shall update the paper trade analysis later this […]
LikeLike
[…] that go through a full write-up on my experimental earnings plays, as I did with FDX, I’ve pulled together a spreadsheet that I’ll use to track hypothetical earnings plays […]
LikeLike