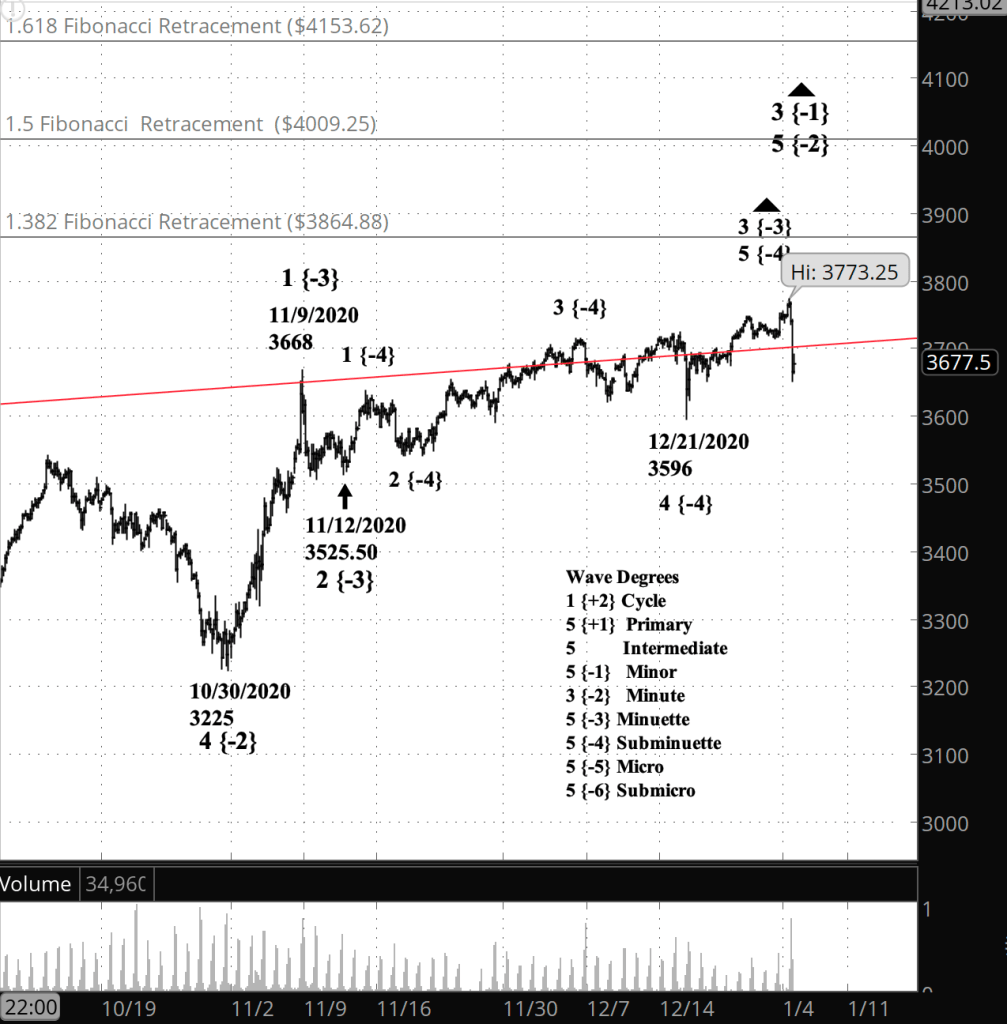
15-minutes before the closing bell. The S&P 500 E-mini futures moved slightly higher above the upper boundary of the Diagonal Triangle. I’ve updated the chart, below.
11:15 a.m. New York time
What’s happening now? The S&P 500 E-mini futures were trading along the upper boundary of the Diagonal Triangle that began in December 2018.
What does it mean? I count the movement as still having some upward potential remaining before hitting one of the three Fibonacci levels marked on the chart..
[S&P 500 E-mini futures at 3:45 p.m., 3-hour bars, with volume]
What does Elliott wave theory say? Now underway, wave 5 of Subminuette degree within wave3 of Minuette degree.
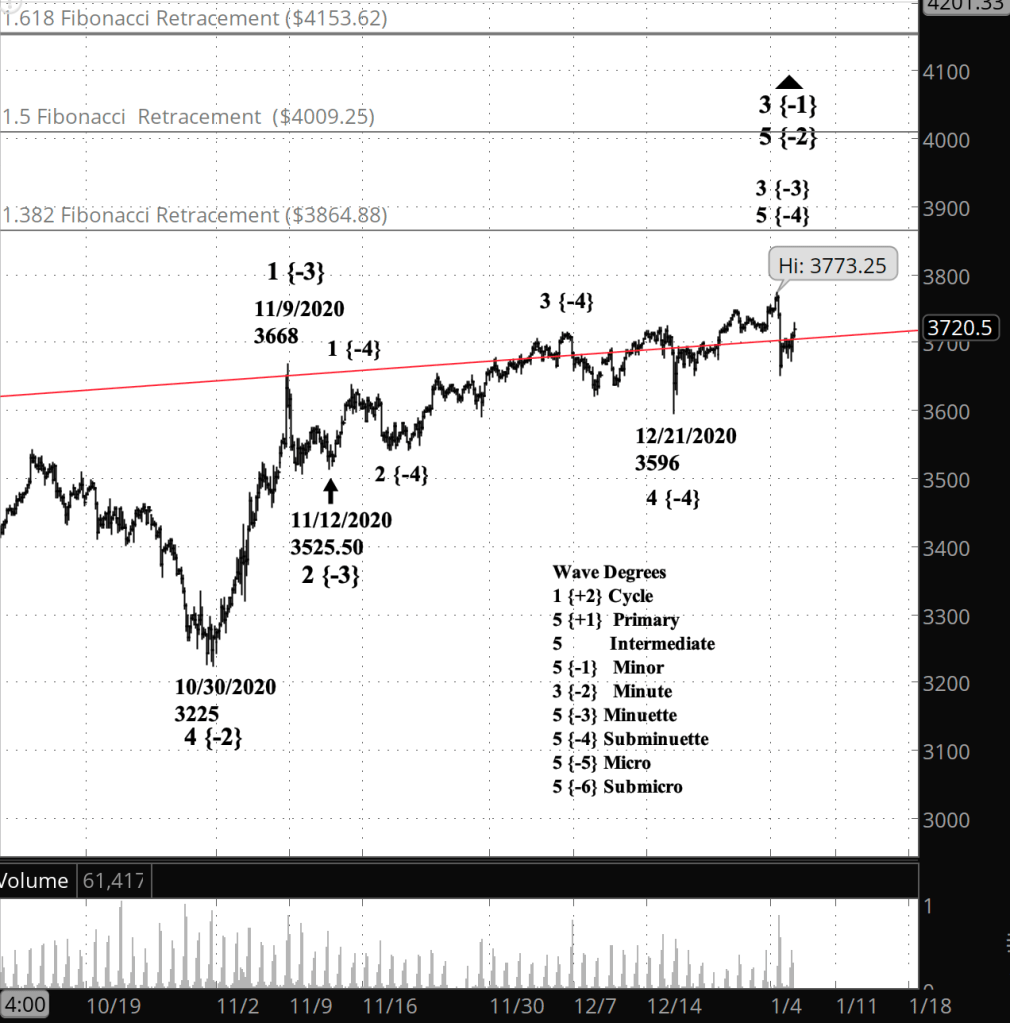
Half an hour before the closing bell. The S&P 500 and derivatives reversed from its peak and dropped 20 points. The E-mini futures peaked at 3773.53 early in the day and then fell to a daily low, so far, of 3652.50. The chart includes the Minor-degree Fibonacci retracement levels for the futures; the Fib’s use in setting targets was discussed below as it applies to the index.
[S&P 500 E-mini futures at 3:30 p.m., 3-hour bars, with volume]
9:45 a.m. New York time
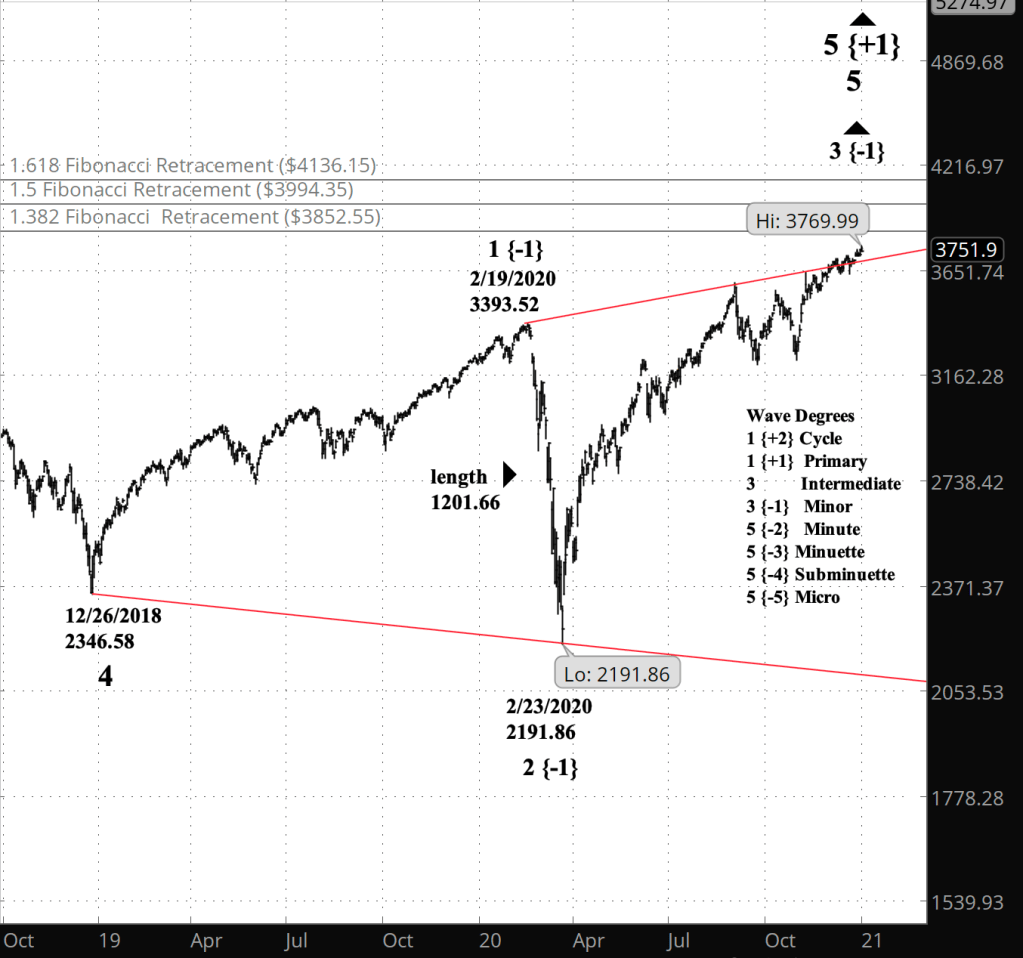
What’s happening now? On the first trading day of 2021, S&P 500 index and E-mini futures continued their rise. The index hit an early high of 3769.99 and the futures, of 3773.25.
What does it mean? The index and its derivatives are on the final leg of a near-term rise that began on December 21, and over the longer term, of a rise that began on February 23.
[S&P 500 index at 9:40 a.m., 3-hour bars]
What does Elliott wave theory say? As the price keeps bouncing up the mountain, let’s make an attempt to establish the peak. One method that’s part of Elliott wave analysis is the Fibonacci level. Often, a third wave will be longer than the preceding third wave by a number in the Fibonacci sequence, with 38.2%, 50% and 61.8% being the most common peaks beyond the length of wave 2.
Looking at the Minor level on the index chart, wave 2 was 1,201.66 points long. That gives us three possible peaks if one of them matches a common Fibonacci level:
3,852.55 at 31.8% beyond the length of wave 2.
3,994.35 at 50% beyond.
4136.15 at 68.2% beyond.
I’ve marked the three levels on the chart, above. Now, the reality of Fibonacci levels is that they are rarely exact. There’s always a bit of fudge regarding where the price will land. So I’ll think of the target as being somewhere between 3,850 and 4,150.
My trading strategy. My short bear call options spreads on IWM expire on January 15, which by my rules means, win or lose, I’ll exit the position on Monday of next week, on January 11. IWM at present is trading at 196 plus change. The top of the profit zone is 192, so the position is a losing one at this point.

You must be logged in to post a comment.