3:30 p.m. New York time
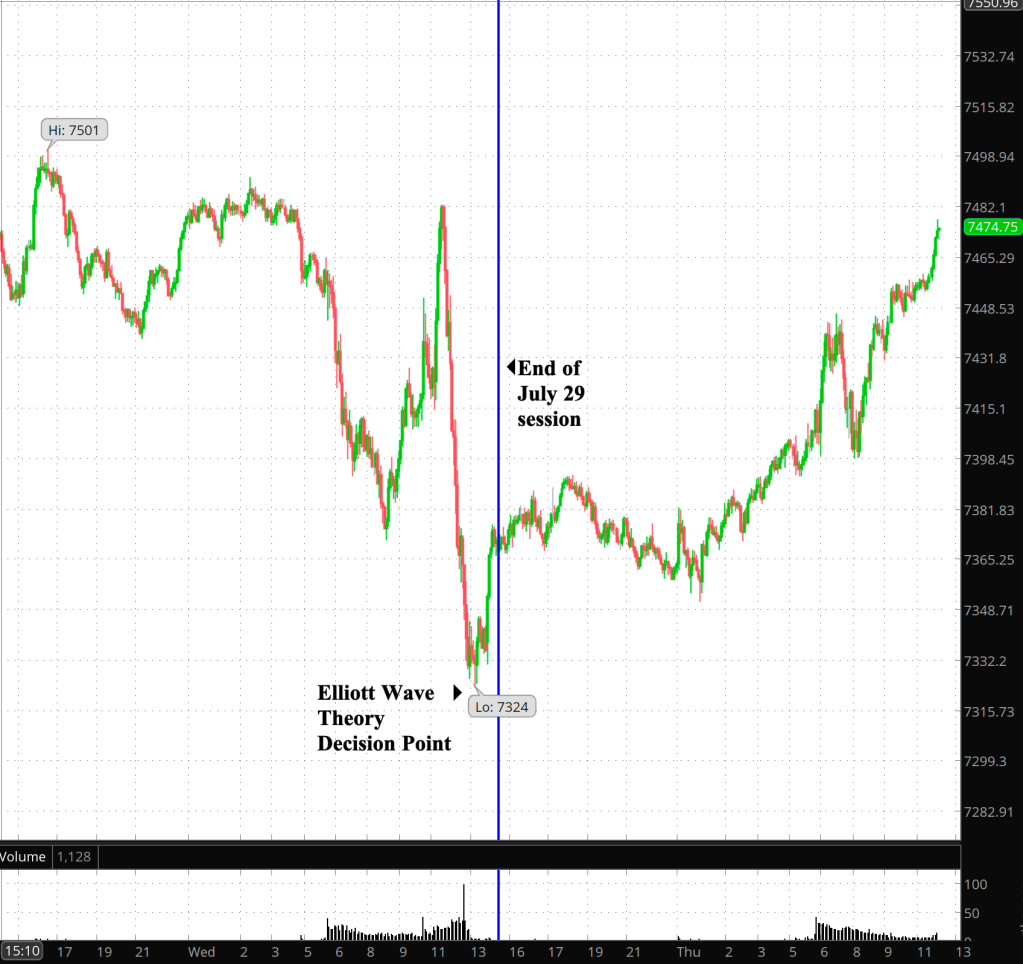
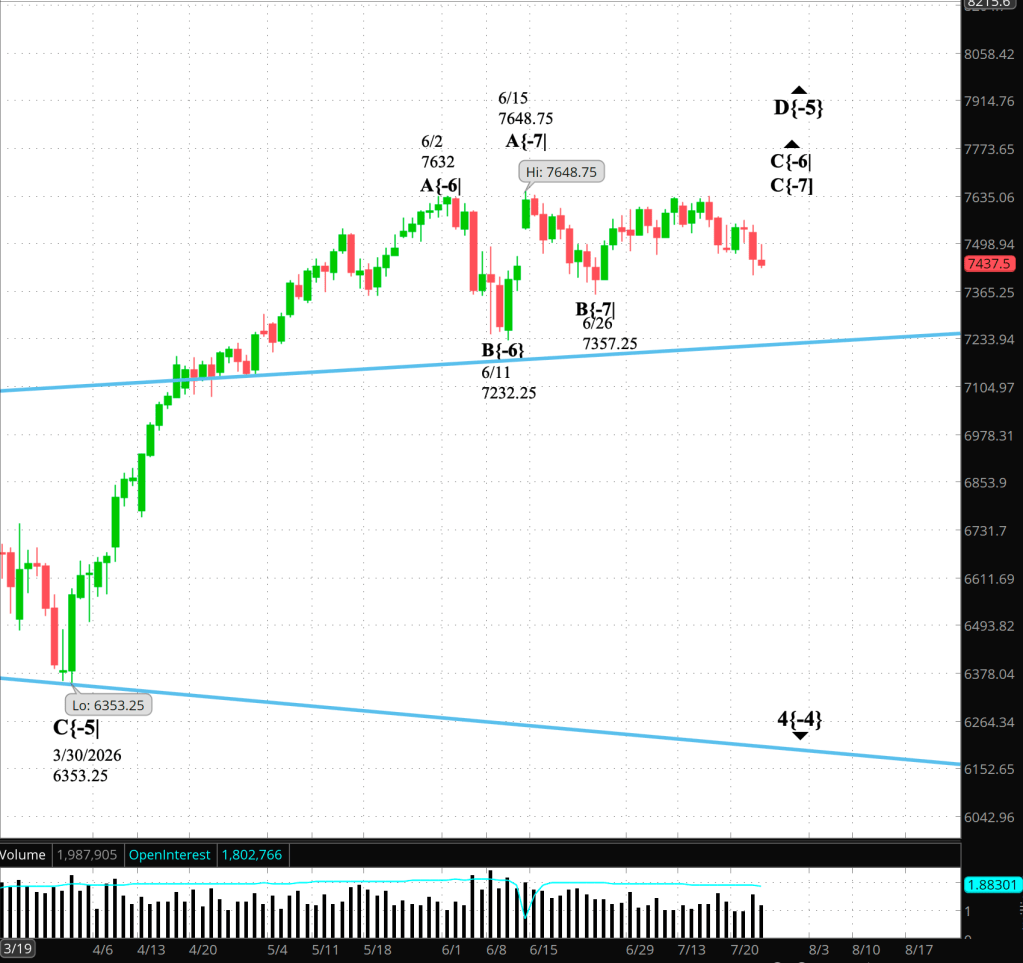
Half an hour before the closing bell. After an early decline, the S&P 500 futures rose during the session, reaching into the 7530s.
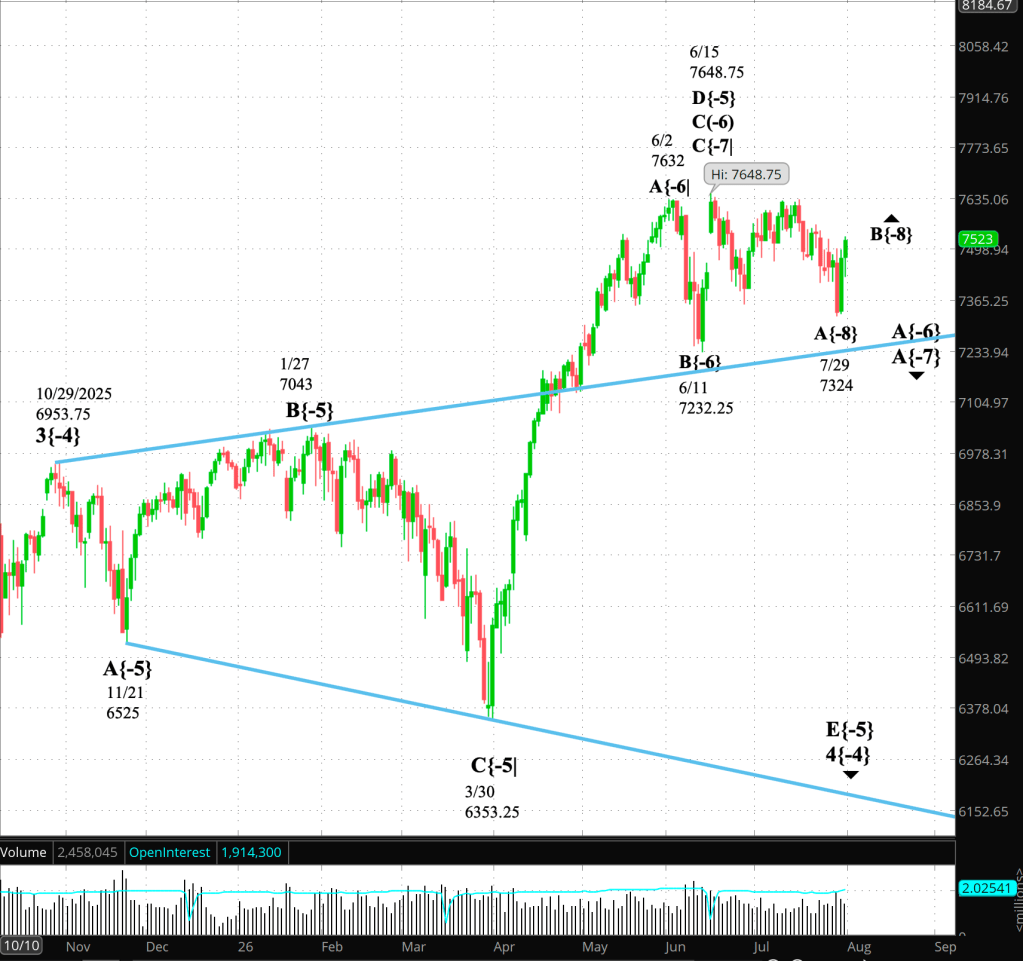
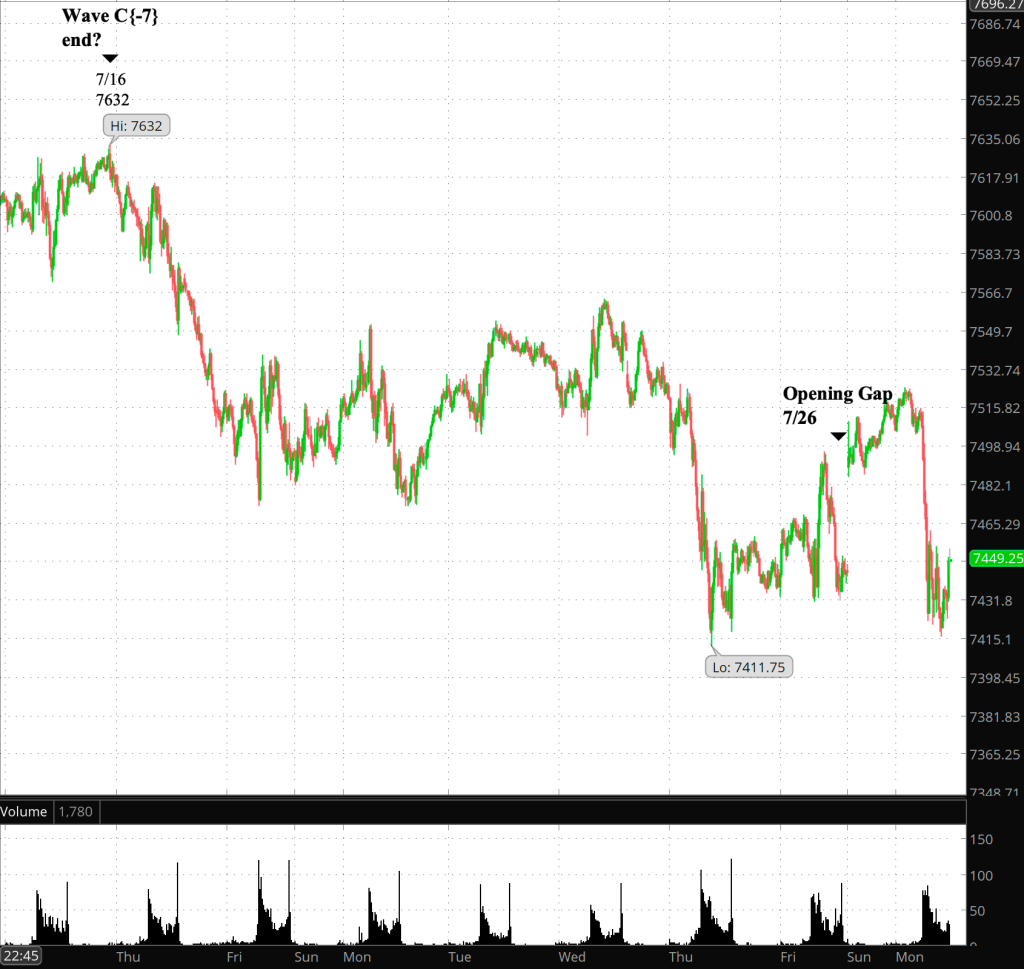
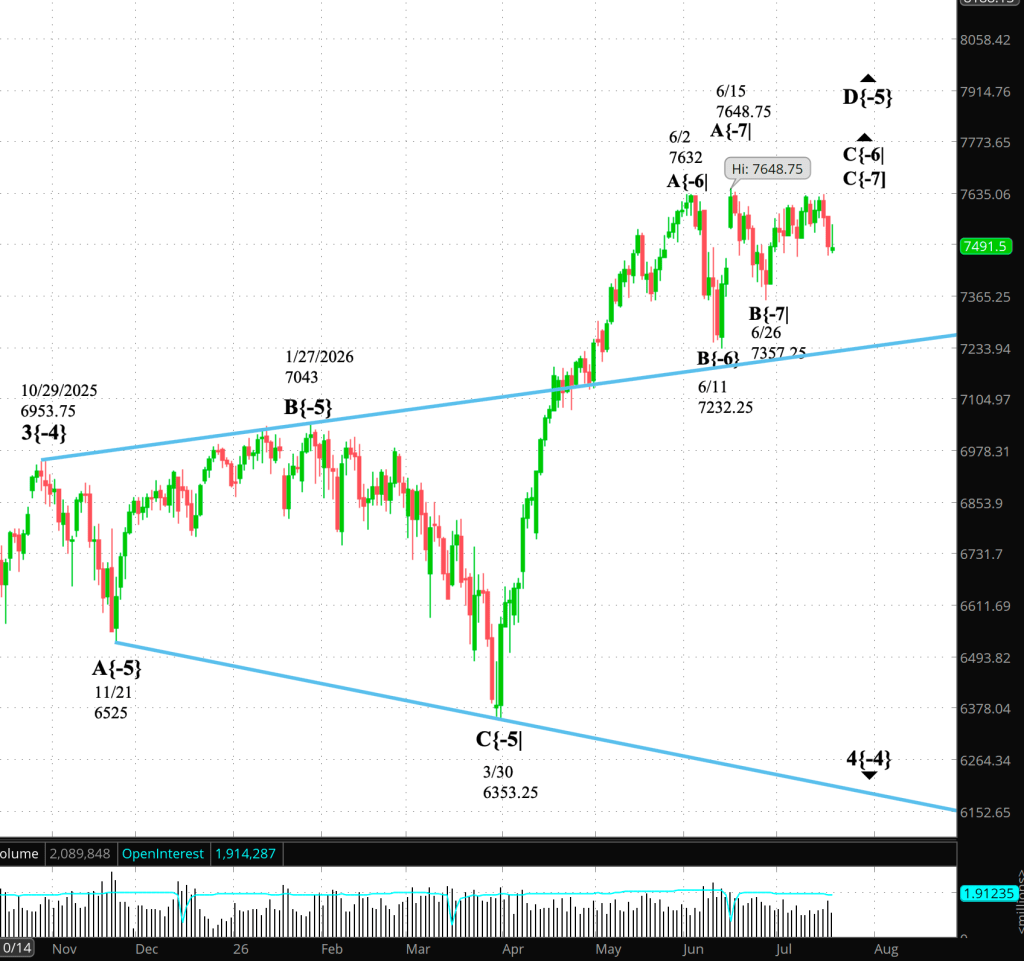
Elliott Wave Theory. The initial subwave within falling wave E{-5}, falling wave A{-6}, is working through its smaller subdivisions. Under the present labeling, falling wave A{-8} ended July 29 at 7324, and rising wave B{-8} began. Today’s early decline was a still smaller correction within that rise.
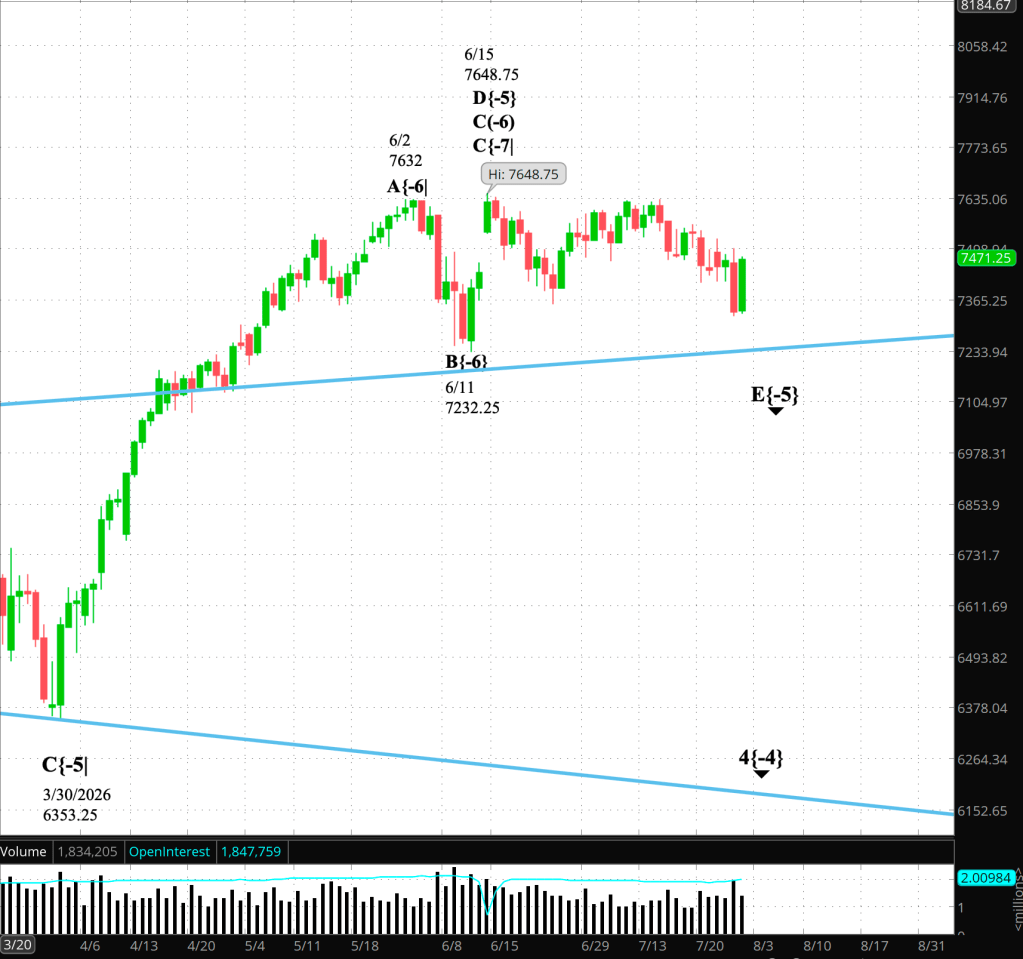
But are the smallest labeled subwaves really of degree {-8}? Or are they one or perhaps two degrees smaller? In considering the question, we must compare them with the waves that came before within the larger wave 4{-4}, a downward correction taking the form of an expanding triangle that contains everything now visible on the chart.
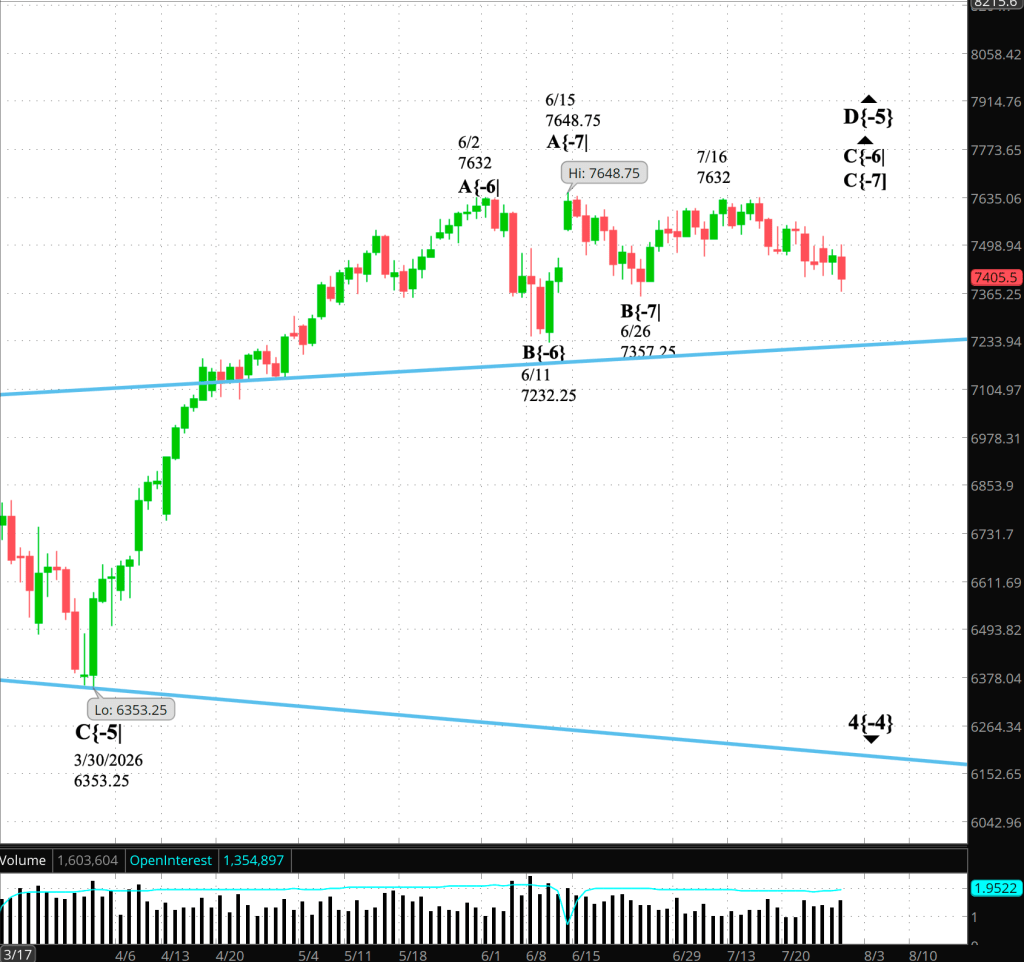
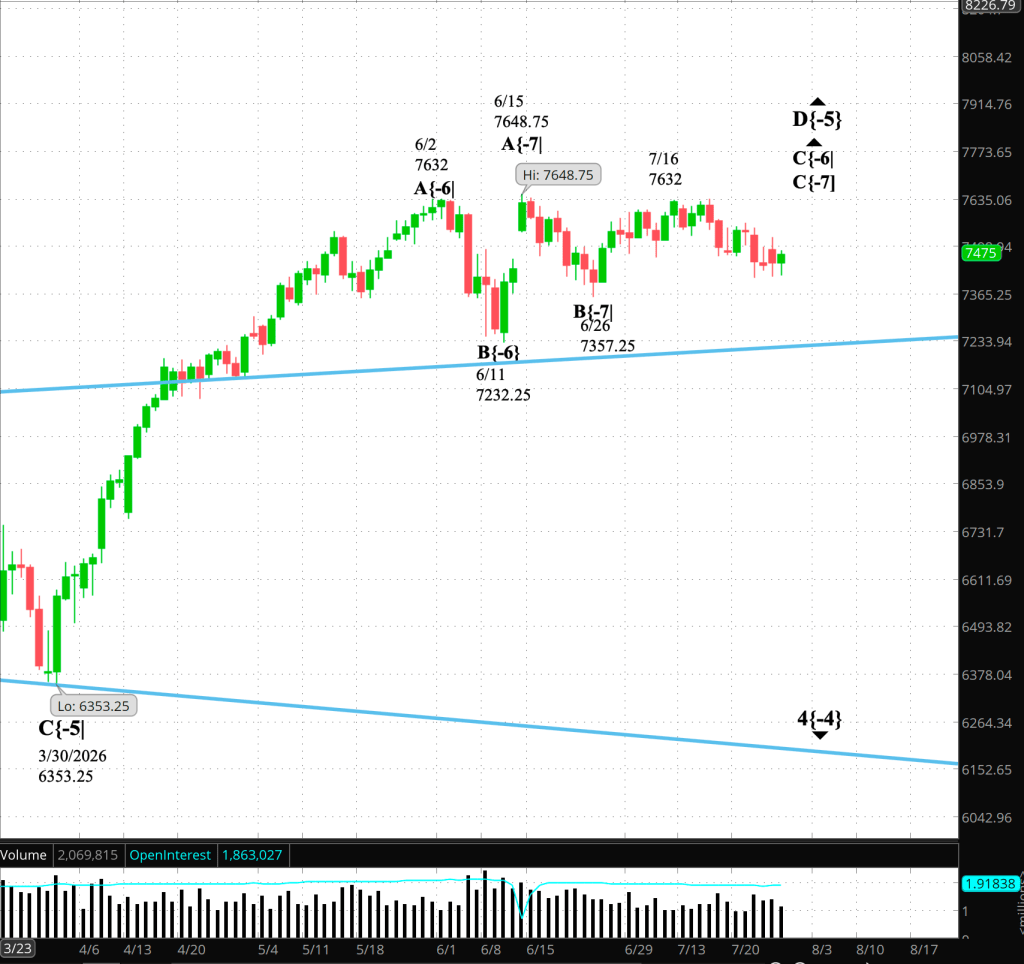
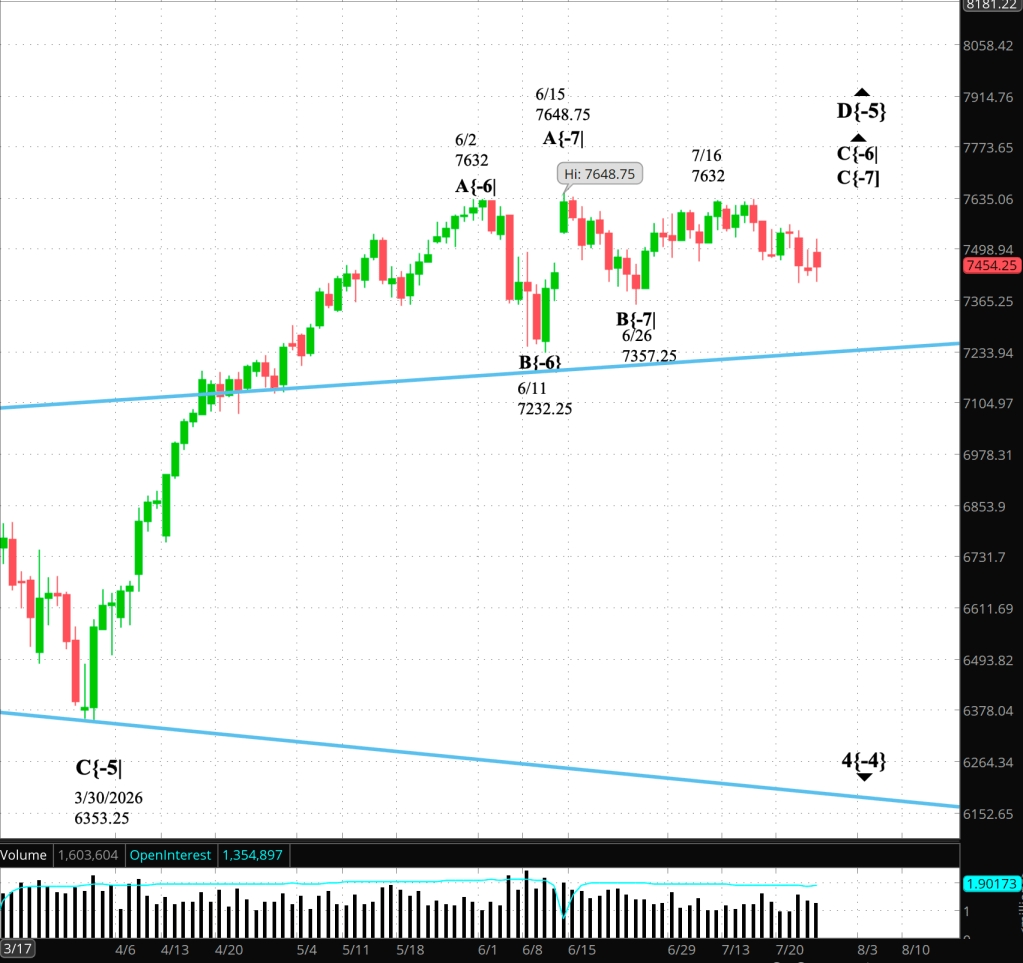
Wave A{-5} took about a month to complete, B{-5} about two months, C{-5} also about two months, and D{-5} about two and a half months.
Wave E{-5} has been underway for a month and a half and has not yet broken below the upper boundary—the blue line on the chart—of the expanding triangle. Under those circumstances, even degree {-8} may be somewhat too large for the smallest visible subwaves. I have provisionally used {-8} on the chart, but remain open to moving them down one degree, or perhaps two, as the structure develops.
See the “Waves Underway” section below for a list of the ongoing waves, arranged from the largest degree to the smallest, with each wave’s Elliott Wave Theory name and starting date and price.
Decision Points. A rise above 7517.75 would extend wave B{-8}. The June highs at 7632 and 7648.75 remain important overhead reference points, with a move above 7648.75 invalidating the present wave E{-5} count. A renewed decline below 7427.50 would weaken the immediate rise, while a break below 7324 would signal that B{-8} had ended and the larger decline within A{-7} had resumed.
9:35 a.m. New York time
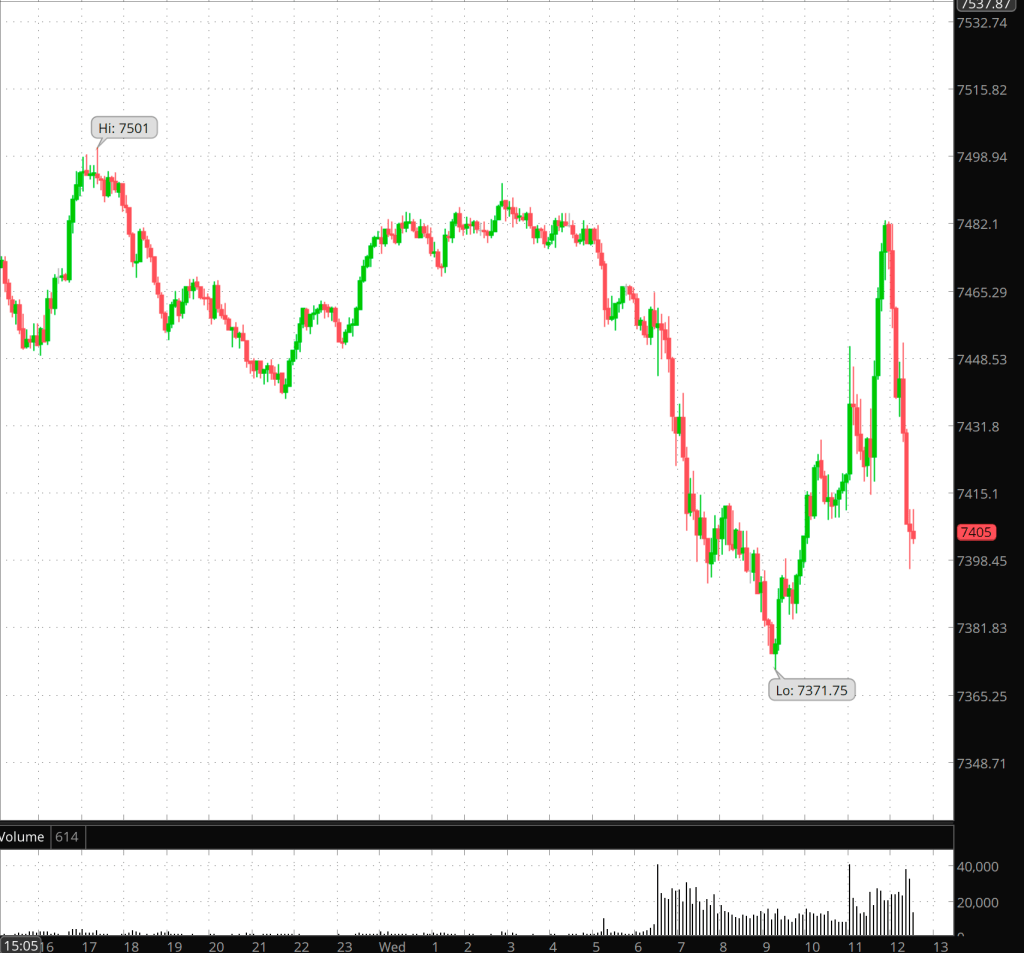
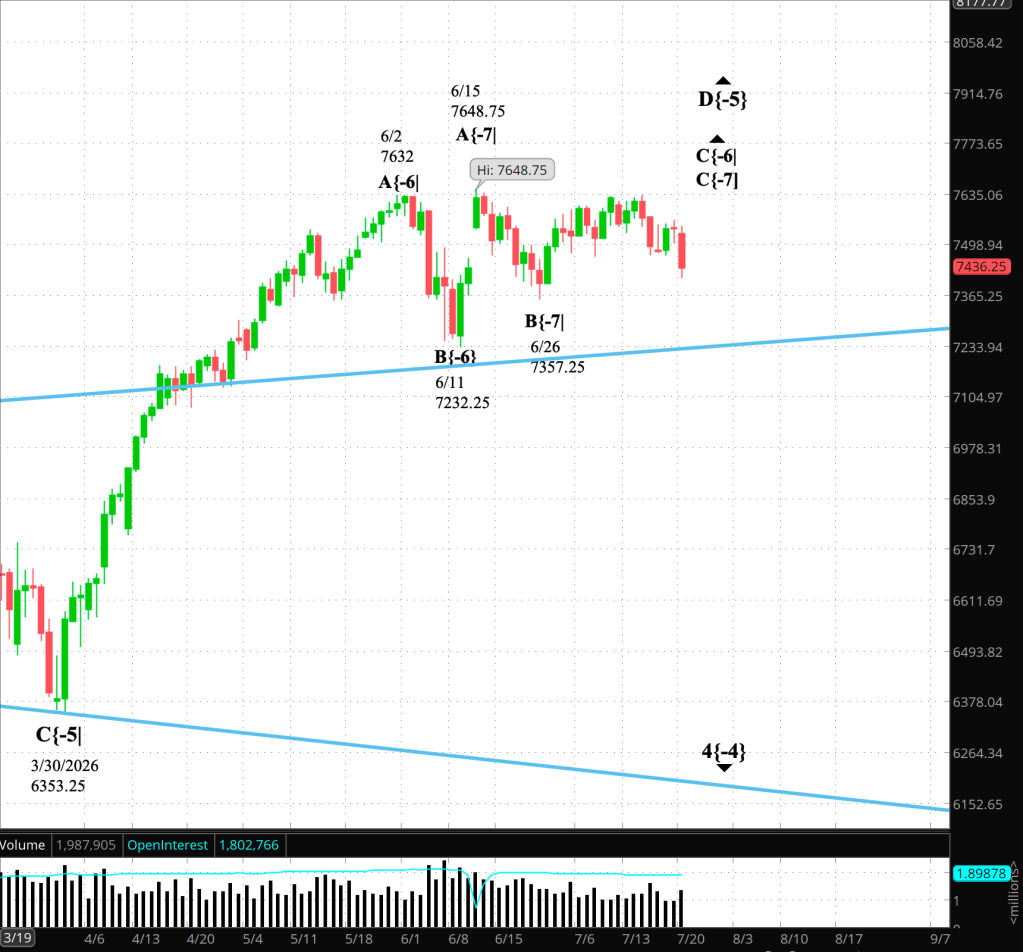
What’s happening now? The S&P 500 E-mini futures continued to rise after yesterday’s session ended, advancing from 7468.25 to 7517.75. As today’s opening bell approached, prices turned lower, falling into the 7470s before beginning another rebound, reaching abover 7500..
What does it mean? Elliott Wave Theory sees the rise as an upward correction within falling wave E{-5}, which began June 15 from 7648.75.
Wave E{-5} is still so young that the correction is probably several degrees smaller than its parent wave—perhaps wave B{-7} within wave A{-6}, or a still smaller wave B{-8} within wave A{-7} within wave A{-6}. As always, the degree—size—of the earliest subwaves is somewhat ambiguous but should gain clarity as the structure develops.
Decision Points. A move above 7517.75 would show that the upward correction remains underway. A decline below 7468.25 would provide the first evidence that the correction has ended and the downtrend has resumed. A fall below 7324 would strengthen that conclusion significantly. A rise above 7648.75 would invalidate the present wave E{-5} count.
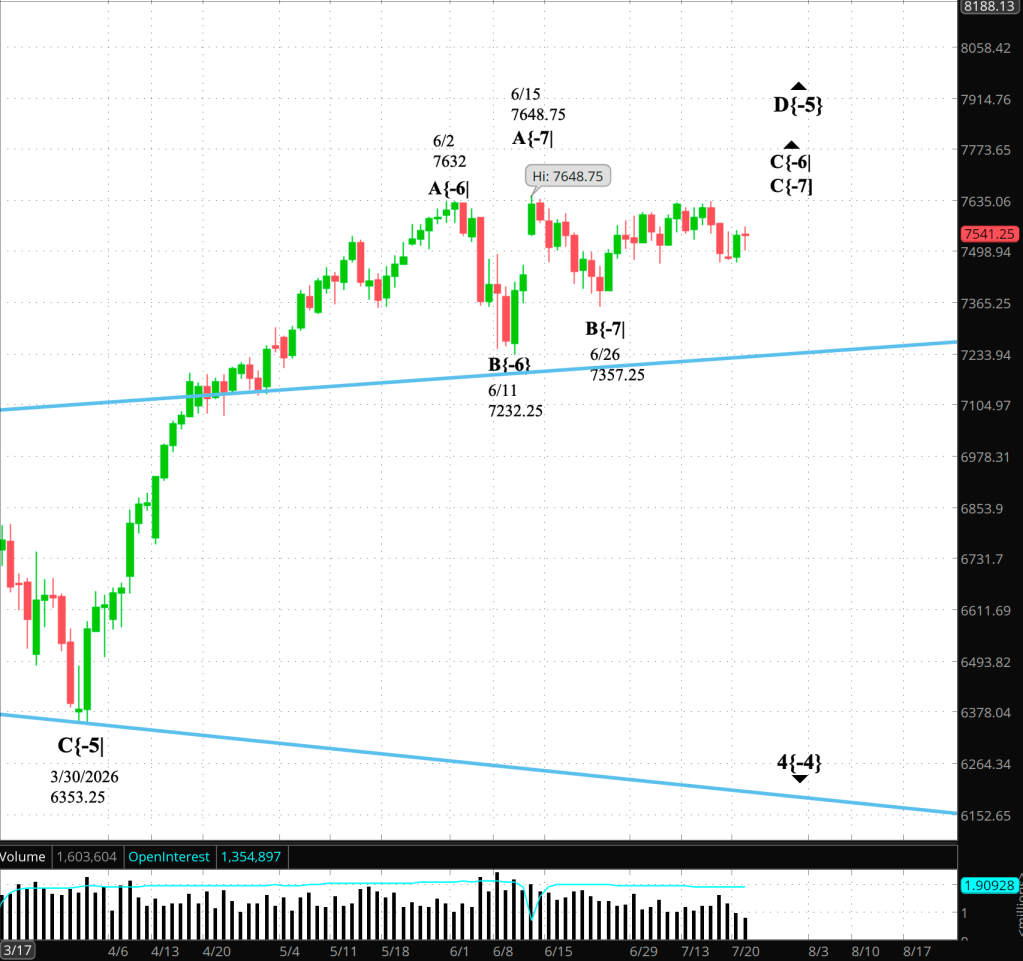
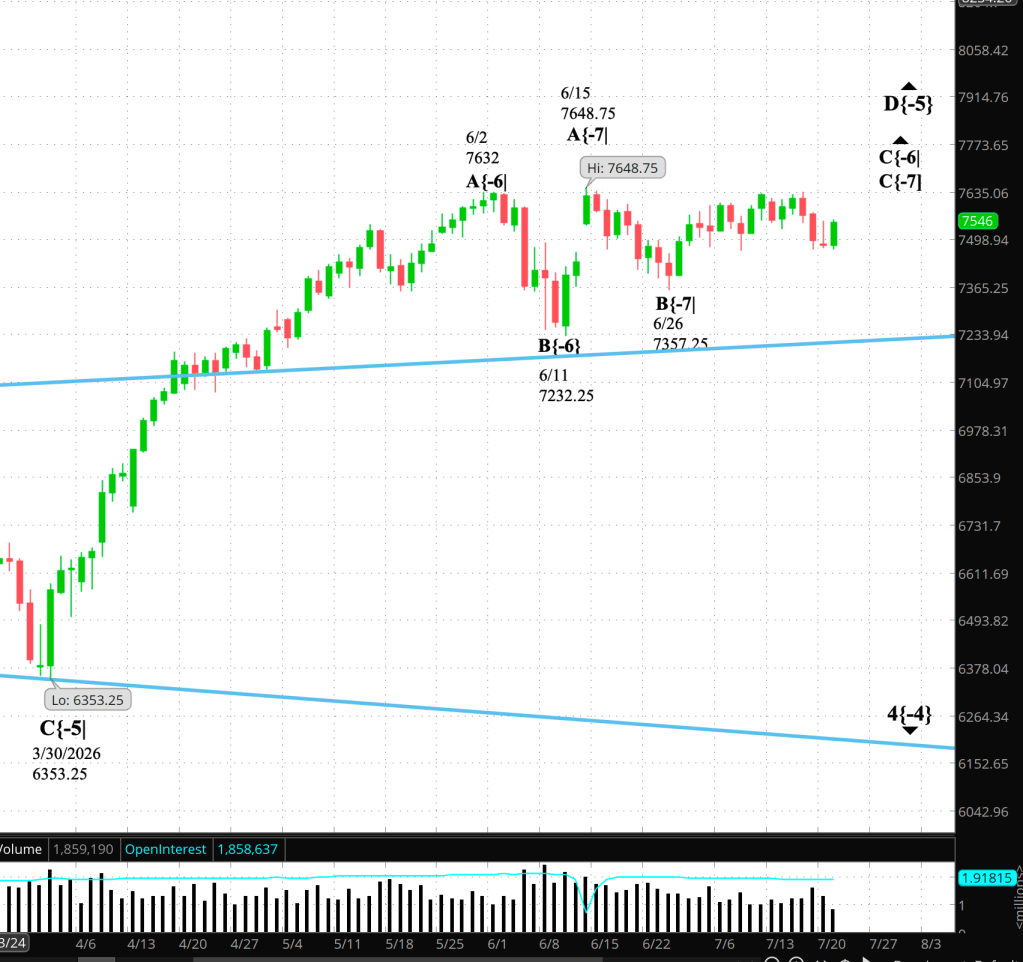
The Chart. Today’s chart focuses on wave 4{-4}, a downward correction that began on October 29, 2025, has taken the form of an expanding triangle, and has entered its final subwave, falling wave E{-5}, The blue lines trace the upper and lower boundaries of the expanding triangle form wave 4{-4} has taken.
[S&P 500 E-mini futures 3:30 p.m., 1-day bars with volume]
Waves Now Underway
These are the waves currently in progress under my principal analysis. Each line on the list shows the wave number, with the subscript in curly brackets, the traditional degree name, the starting date, the starting price of the S&P 500 E-mini futures, and the direction of the wave.
- S&P 500 Index:
- 5{+3} Supercycle, 7/8/1932, 4.40 (up)
- 5{+2} Cycle, 12/9/1974, 60.96 (up)
- 5{+1} Primary, 3/6/2009, 666.79 (up)
- 5{0} Intermediate, 2/11/2016, 1810.10 (up)
- 3{-1} Minor, 3/23/2020, 2191.36 (up)
- 1{-2} Minute, 7/31/2025, 6468.50 (down)
- S&P 500 E-mini futures
- 5{-3} Minuette 8/1/2025, 6239.50 (up)
- 4{-4} Subminutte 10/29/2025, 6953.75 (down)
- E{-5} Micro, 6/15/2026, 6353.25 (down)
- A{-6} Submicro, 6/15/2026, 6353.25 (down)
- A{-7} Minuscule, 6/15/2026, 6353.25 (down)
- B{-8} (no name), 7/29/2026, 7324 (up)
Reading the chart. Price movements — waves – – in Elliott Wave Theory analysis are labeled with numbers within trending waves and letters with corrective waves. The subscripts — numbers in curly brackets — designate the wave’s degree, which, in Elliott Wave analysis, means the relative position of a wave within the larger and smaller structures that make up the chart.R.N. Elliott, who in the 1930s developed the form of analysis that bears his name, viewed the chart as a complex structure of smaller waves nested within larger waves, which in turn are nested within still larger waves. In mathematics it’s called a fractal structure, where at every scale the pattern is similar to the others.
Learning and other resources. Elliott Wave analysis provides context, not prophecy. As the 20th century semanticist Alfred Korzybski put it in his book Science and Sanity(1933), “The map is not the territory… The only usefulness of a map depends on similarity of structure between the empirical world and the map.” And I would add, in the ever-changing markets, we can judge that similarity of structure only after the fact.
See the menu pageAnalytical Methodsfor a rundown on where to go for information on Elliott Wave analysis.
By Tim Bovee, Portland, Oregon, July 31, 2026
Disclaimer
Tim Bovee, Private Trader tracks the analysis and trades of a private trader managing his own accounts. The content reflects my interpretation of market structure, including Elliott Wave Theory and related tools.
Nothing in this blog constitutes a recommendation to buy or sell stocks, options, or any other financial instrument, or to pursue any particular strategy. The purpose of this blog is education and entertainment.
No trader is ever 100 percent successful. Trading in stock and options markets involves risk and uncertainty. Each trader must make decisions for his or her own account and accept full responsibility for the outcomes.
Charts and tools are used to support my personal analysis. Any data displayed is illustrative of that analytical process and is not presented as a source of market data for redistribution.
All content on Tim Bovee, Private Trader byTimothy K. Boveeis licensed under a Creative Commons Attribution-ShareAlike 4.0 International License.
License
Based on work atwww.timbovee.com

You must be logged in to post a comment.