3:30 p.m. New York time
Half an hour before the closing bell. The S&P 500 futures rose during the session to 4305.75 and then declined sharply into the 4270s. The low-degree fluctuation is part of the upward correction that began on October 13 of last year.
Within that correction, the rise that began on May 31, rising wave E{-11}, is in its next-to-the-last internal wave, declining wave D{-12}, which will be followed by a final push to the upside, wave E{-12}.
The completion of wave E{-12} will cascade up the waves of increasingly larger degree, marking the end of each, all the way up to the correction itself, wave 2{-7}.
I’ve updated the upper, close-up chart of the futures and have left the lower, big picture chart of the index as it was this morning.
9:35 a.m. New York time
What’s happening now? The S&P 500 E-mini futures stayed within a narrow band, in the 4290s and 4280s after trading resumed overnight.
What does it mean? The upward correction that began on October 13, 2022 still has a short distance remaining before it reaches completion.
The correction high so far is 4297.75 on the futures. The price must remain below the starting point of the downtrending wave that preceded the correction, 4327.51. On the S&P 500 index, the correction high is 4290.67, and the downtrending wave that preceded the correction began from 4325.28.
Under the rules of Elliott wave theory, those starting points put a firm limit on how high the correction can rise. If the price does exceed those limits, then the analysis no longer matches the chart and will be redone.
When the upward correction is complete, it will be followed by an energetic downtrend that will eventually carry the price far below present levels.
What are the alternatives? There are two. A decisive move to the downside will confirm one scenario or the other, but won’t identify which one.
Alternative #1, correction has ended: The correction may have ended at the present high point.
Alternative #2, compound correction: The correction may form a compound structure. The end of the present corrective pattern won’t complete the correction. Instead, it will be followed by a declining connecting wave and then a second corrective pattern. Compound corrections can be formed from as many as three corrective patterns. If this alternative happens, it will delay the start of the downtrend.
Reading the chart. I’ve posted two charts today. The upper chart shows the final rise of the upward correction, beginning on May 31. The lower chart shows the very large final wave of an uptrend that contains everything the markets have done since December 26, 2018. That final wave is taking the form of an expanding Diagonal Triangle, whose trendlines are marked in blue.
On both charts, a horizontal line in red marks the mandatory upper boundary of the upward correction under the present analysis.
Price movements — waves – – in Elliott wave analysis are labeled with numbers within trending waves and letters with corrective waves. The subscripts — numbers in curly brackets — designate the wave’s degree, which, in Elliott wave analysis, means the relative position of a wave within the larger and smaller structures that make up the chart. R.N. Elliott, who in the 1930s developed the form of analysis that bears his name, viewed the chart as a complex structure of smaller waves nested within larger waves, which in turn are nested within still larger waves. In mathematics it’s called a fractal structure, where at every scale the pattern is similar to the others.
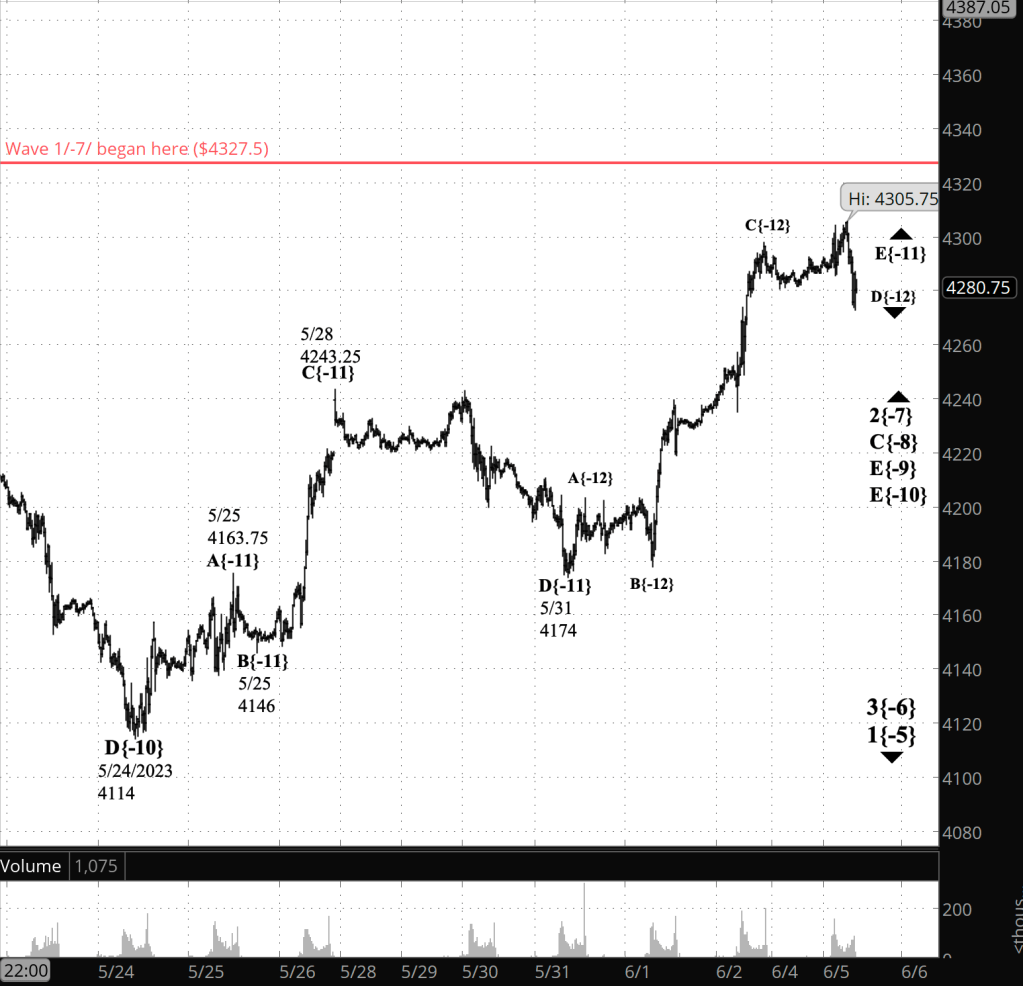
[S&P 500 E-mini futures at 3:30 p.m., 20-minute bars, with volume]
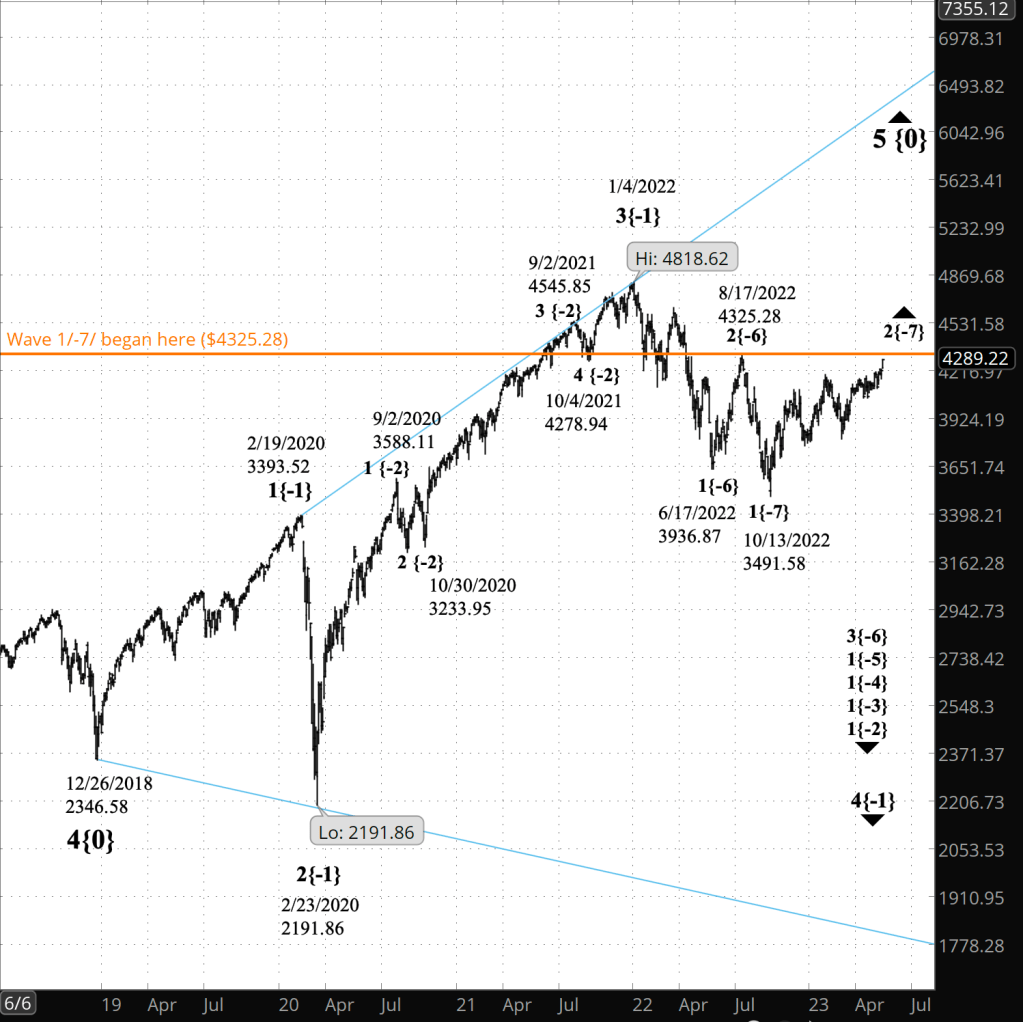
[S&P 500 index at 9:35 a.m., 2-day bars, with volume]
What does Elliott wave theory say? Here are the waves that underly the analyses. The We Are Here section below lists the waves encompassing the upward correction, wave 2{-7}, up to the expanding Diagonal Triangle, wave 5{0}, which began on January 4, 2022, and still larger, to uptrending wave 5{-3}, which began on July 8, 1932.
Principal analysis:
- An upward correction, wave 2{-7}, began on October 13, 2022 and is underway.
- The correction’s first subwave, wave A{-8}, had five subwaves, meaning the correction is taking the form of a Zigzag
- Wave 2{-7} is in its final subwave wave, C{-8}, which began on March 13, 2023.
- Wave C{-7} is in its final subwave, wave E{-9}.
- Internally, wave E{-9} is in its final subwave, E{10}, which is also in its final subwave, E{-11}.
- The end of wave E{-11} will cascade up the wave degrees, marking the end of waves E{-10}, E{-9}, C{-8} and of the correction, wave 2{-7}.
- Downtrending wave 3{-7} will follow the end of the correction and will carry the price a significant distance below present levels.
Alternative #1, correction has ended:
- Wave E{-11} is the smallest wave labelled on the chart.
- It may have ended at the present high point in the correction, and if it did, then the correction, wave 2{-7}, has also ended.
- If so, then wave 3{-7}, a powerful downtrend, is taking its first steps.
Alternative analysis #2, compound correction:
- The end of wave C{-8} may won’t be the end of the wave 2{-7} correction.
- Wave 2{-7} will form a compound structure and wave C{-8} ends the first corrective pattern.
- Wave C{-8} will be followed by a declining connector, wave X{-8}, and then by a second corrective pattern.
We Are Here.
These are the waves currently in progress under my principal analysis. Each line on the list shows the wave number, with the subscript in curly brackets, the traditional degree name, the starting date, the starting price of the S&P 500 E-mini futures, and the direction of the wave.
- S&P 500 Index:
- 5{+3} Supercycle, 7/8/1932, 4.40 (up)
- 5{+2} Cycle, 12/9/1974, 60.96 (up)
- 5{+1} Primary, 3/6/2009, 666.79 (up)
- 5{0} Intermediate, 12/26/2018, 2346.58 (up)
- S&P 500 Futures and index:
- 4{-1} Minor, 1/4/2022, 4808.25 (down) (futures), 4818.62 (down) (index)
- S&P 500 Futures:
- 1{-2} Minute, 1/4/2022, 4808.25 (down)
- 1{-3} Minuette, 1/4/2022, 4808.25 (down)
- 1{-4} Subminuette, 1/4/2022, 4808.25 (down)
- 1{-5} Micro, 1/4/2022, 4808.25 (down)
- 3{-6} Submicro, 8/16/2022, 4327.50 (down)
- 2{-7} Minuscule, 10/13/2022, 3577.75 (up)
Learning and other resources. Elliott wave analysis provides context, not prophecy. As the 20th century semanticist Alfred Korzybski put it in his book Science and Sanity (1933), “The map is not the territory … The only usefulness of a map depends on similarity of structure between the empirical world and the map.” And I would add, in the ever-changing markets, we can judge that similarity of structure only after the fact.
See the menu page Analytical Methods for a rundown on where to go for information on Elliott wave analysis.
By Tim Bovee, Portland, Oregon, June 5, 2023
Disclaimer
Tim Bovee, Private Trader tracks the analysis and trades of a private trader for his own accounts. Nothing in this blog constitutes a recommendation to buy or sell stocks, options or any other financial instrument. The only purpose of this blog is to provide education and entertainment.
No trader is ever 100 percent successful in his or her trades. Trading in the stock and option markets is risky and uncertain. Each trader must make trading decisions for his or her own account, and take responsibility for the consequences.
License
All content on Tim Bovee, Private Trader by Timothy K. Bovee is licensed under a Creative Commons Attribution-ShareAlike 4.0 International License.
Based on a work at www.timbovee.com.

[…] of the former analysis, see the futures chart posted last Friday, June 9. For a broader context, see the index chart posted on June […]
LikeLike