3:30 p.m. New York time
Half an hour before the closing bell. The upward correction that began on October 13, 2022 from 3577.75 may have ended today, at 4325.50 on the S&P 500 futures, two points below the maximum level for that 2nd wave correction under the rules of Elliott wave analysis.
However, two points isn’t nothing, and it is possible that there will be a final push that will move a bit past that high.
I’m leaning toward the scenario that sees the 2nd wave correction as complete, but I’m keeping the chart labeled according to this morning’s analysis, because it’s equally probable that the final push up alternative will play out. It’s a decision based on caution.
One argument in favor of today’s high being the correction’s end is the wave pattern that has followed the peak: A clear five waves down of small degree, the pattern seen in a trending wave, which implies that the parent wave a number of degrees larger is the 3rd wave downtrend following the correction.
The following chart of today’s price movements shows the pattern, pointed to by a red arrow.
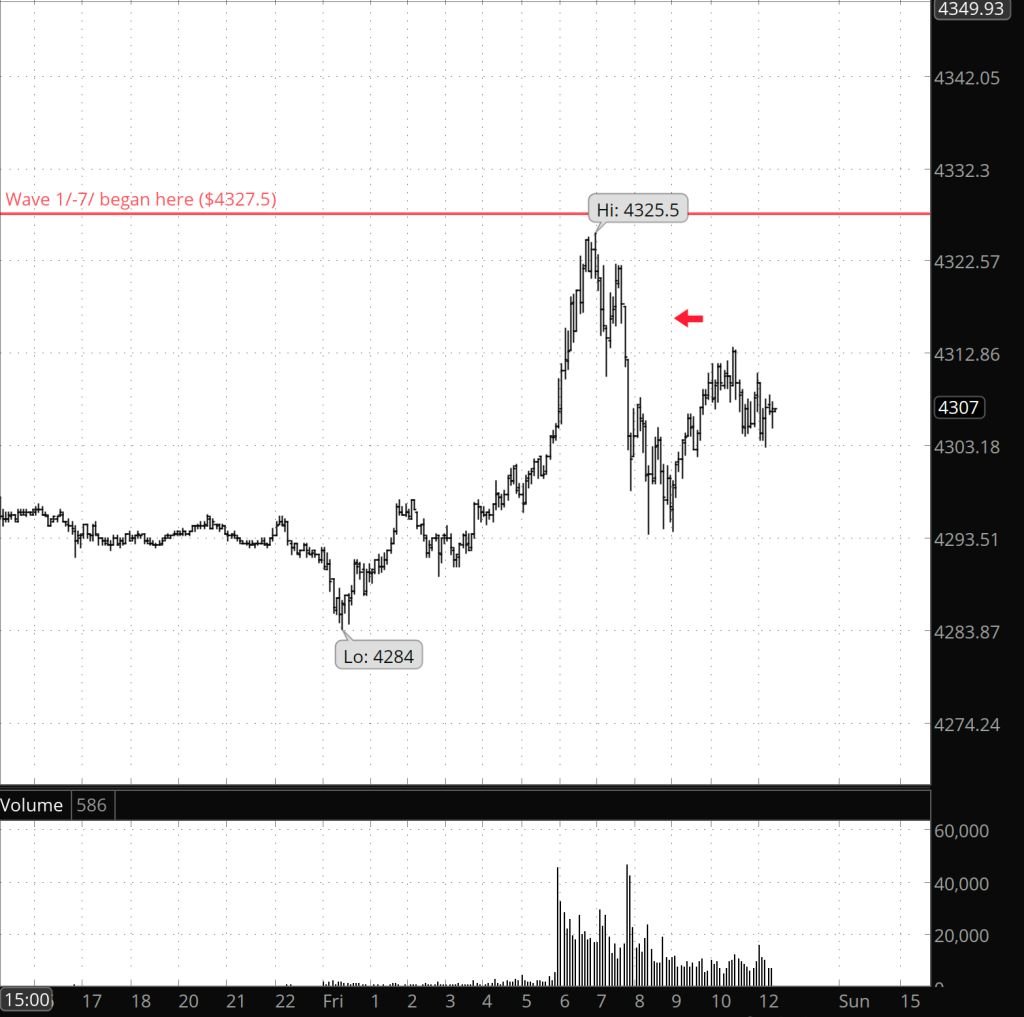
[S&P 500 E-mini futures at 3:30 p.m., 5-minute bars, with volume]
9:35 a.m. New York time
What’s happening now? The S&P 500 E-mini futures rose overnight, traveling from the 4280s to, by the opening bell, 4310 and above.
What does it mean? The price exceeded the prior high in the upward correction, 4305.75, set on June 6. The upward correction that began last fall continues and is very close to its end. At this point, every new high in the correction could be it’s end.
Under the rules of Elliott wave analysis, the correction, a 2nd wave, cannot exceed the starting price of the preceding 1st wave, 4327.50, shown on the chart as a horizontal red line. If the price does rise above that even, then the analysis will no longer match the reality of the chart, and I’ll do a reanalysis.
What is the alternative? The correction may form a compound structure. The end of the present corrective pattern won’t complete the correction. Instead, it will be followed by a declining connecting wave and then a second corrective pattern. Compound corrections can be formed from as many as three corrective patterns. If this alternative happens, it will delay the start of the downtrend.
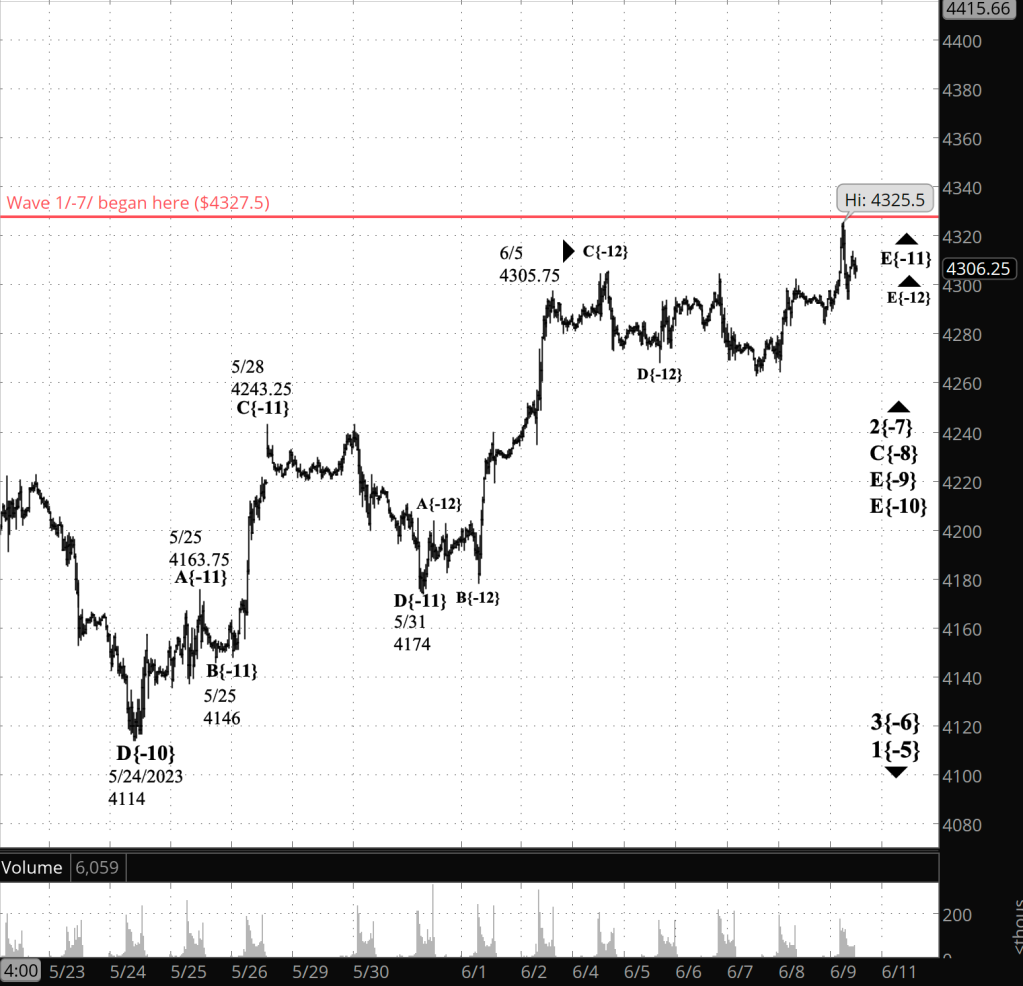
[S&P 500 E-mini futures at 3:30 p.m., 30-minute bars, with volume]
What does Elliott wave theory say? Here are the waves that underly the analyses.
Principal analysis:
- An upward correction, wave 2{-7}, began on October 13, 2022 and is underway.
- The correction’s first subwave, wave A{-8}, had five subwaves, meaning the correction is taking the form of a Zigzag
- Wave 2{-7} is in its final subwave wave, C{-8}, which began on March 13, 2023.
- Wave C{-7} is in its final subwave, wave E{-9}.
- Internally, wave E{-9} is in its final subwave, E{10}, which is also in its final subwave, E{-11}, which in turn is in its final subwave, E{-12}.
- The end of wave E{-12} will cascade up the wave degrees, marking the end of waves E{-10}, E{-9}, C{-8} and of the correction, wave 2{-7}.
- Downtrending wave 3{-7} will follow the end of the correction and will carry the price a significant distance below present levels.
Alternative analysis, compound correction:
- The end of wave C{-8} may won’t be the end of the wave 2{-7} correction.
- Wave 2{-7} will form a compound structure and wave C{-8} ends the first corrective pattern.
- Wave C{-8} will be followed by a declining connector, wave X{-8}, and then by a second corrective pattern.
Reading the chart. Price movements — waves – – in Elliott wave analysis are labeled with numbers within trending waves and letters with corrective waves. The subscripts — numbers in curly brackets — designate the wave’s degree, which, in Elliott wave analysis, means the relative position of a wave within the larger and smaller structures that make up the chart. R.N. Elliott, who in the 1930s developed the form of analysis that bears his name, viewed the chart as a complex structure of smaller waves nested within larger waves, which in turn are nested within still larger waves. In mathematics it’s called a fractal structure, where at every scale the pattern is similar to the others.
We Are Here.
These are the waves currently in progress under my principal analysis. Each line on the list shows the wave number, with the subscript in curly brackets, the traditional degree name, the starting date, the starting price of the S&P 500 E-mini futures, and the direction of the wave.
- S&P 500 Index:
- 5{+3} Supercycle, 7/8/1932, 4.40 (up)
- 5{+2} Cycle, 12/9/1974, 60.96 (up)
- 5{+1} Primary, 3/6/2009, 666.79 (up)
- 5{0} Intermediate, 12/26/2018, 2346.58 (up)
- S&P 500 Futures and index:
- 4{-1} Minor, 1/4/2022, 4808.25 (down) (futures), 4818.62 (down) (index)
- S&P 500 Futures:
- 1{-2} Minute, 1/4/2022, 4808.25 (down)
- 1{-3} Minuette, 1/4/2022, 4808.25 (down)
- 1{-4} Subminuette, 1/4/2022, 4808.25 (down)
- 1{-5} Micro, 1/4/2022, 4808.25 (down)
- 3{-6} Submicro, 8/16/2022, 4327.50 (down)
- 2{-7} Minuscule, 10/13/2022, 3577.75 (up)
Learning and other resources. Elliott wave analysis provides context, not prophecy. As the 20th century semanticist Alfred Korzybski put it in his book Science and Sanity (1933), “The map is not the territory … The only usefulness of a map depends on similarity of structure between the empirical world and the map.” And I would add, in the ever-changing markets, we can judge that similarity of structure only after the fact.
See the menu page Analytical Methods for a rundown on where to go for information on Elliott wave analysis.
By Tim Bovee, Portland, Oregon, June 9, 2023
Disclaimer
Tim Bovee, Private Trader tracks the analysis and trades of a private trader for his own accounts. Nothing in this blog constitutes a recommendation to buy or sell stocks, options or any other financial instrument. The only purpose of this blog is to provide education and entertainment.
No trader is ever 100 percent successful in his or her trades. Trading in the stock and option markets is risky and uncertain. Each trader must make trading decisions for his or her own account, and take responsibility for the consequences.
License
All content on Tim Bovee, Private Trader by Timothy K. Bovee is licensed under a Creative Commons Attribution-ShareAlike 4.0 International License.
Based on a work at www.timbovee.com.

[…] now underway, that began on October 13, 2022. For a near-term view of the former analysis, see the futures chart posted last Friday, June 9. For a broader context, see the index chart posted on June […]
LikeLike