3:30 p.m. New York time
Half an hour before the closing bell. The S&P 500 peaked early in the session at 4439.50 and then dropped sharply to 4383.50 after the Federal Open Market Committee announced it had decided to hold rates steady this month. No change in the analysis. I’ve updated the chart.
9:35 a.m. New York time
What’s happening now? The S&P 500 E-mini futures rose to 4428 in overnight trading, above the 61.8% Fibonacci retracement level.
What does it mean? The upward correction that began on October 13, 2022 continues and is in its 1st subwave.
The upward limit of the correction, under the rules of Elliott wave theory, is 4953.25, the starting point of the downtrending wave that preceded the correction. The price has been adjusted slightly higher to eliminate a price mislabeling by the chart software.
What are the alternatives? It’s possible to see the correction as taking a compound form, containing two corrective patterns. I’ve placed the wave labels for this alternative on the chart in blue. A compound correction can have as many as three corrective patterns, each separated from its predecessor by an X wave.
If the alternative correction turns out to be the best match for the chart, then the upward correction is further along than the principal analysis would have it. The second corrective pattern is in its final subwave under this scenario, and that final subwave may be the end of the correction, or it may be followed by a third corrective pattern.
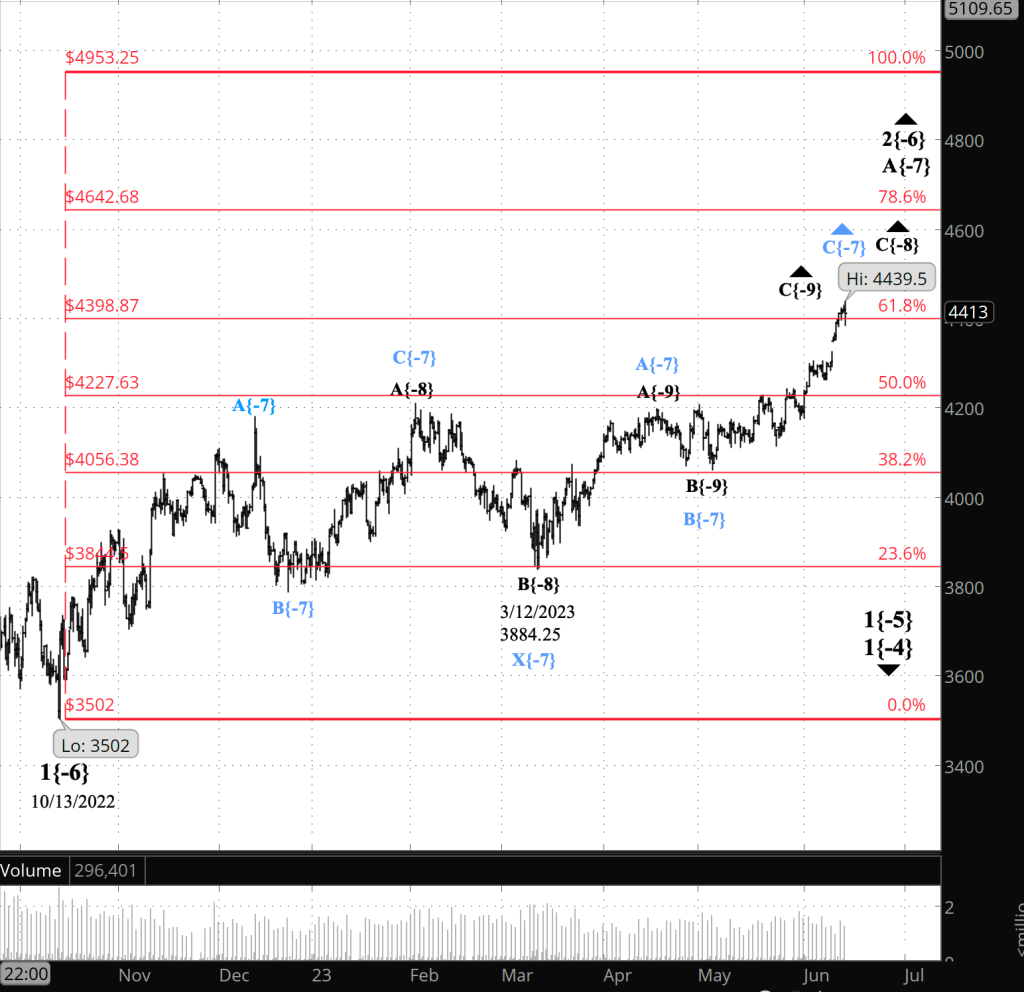
[S&P 500 E-mini futures at 3:30 p.m., 8-hour bars, with volume]
What does Elliott wave theory say? Here are the waves that underly the revised analyses.
Principal analysis, simple correction (black labeling on the chart):
- An upward correction, wave 2{-6}, began on October 13, 2022 and is underway.
- The correction’s first subwave, wave A{-7}, is underway and will have five subwaves.
- Wave A{-7} at present is in its 3rd subwave, wave C{-8}.
- Wave C{-8} is in its 3rd subwave, wave C{-9}.
- Wave 2{-6}, when complete, will be followed by a powerful downtrend, wave 3{-6}.
- Under the rules of Elliott wave analysis, wave 2{-6} cannot move beyond the beginning of wave 1{-6}, which was the January 4, 2022 peak at 4953.25. (I’ve adjusted the January 4 peak.)
Alternative analysis, compound correction (blue labeling on the chart):
- The upward correction, wave 2{-6}, is taking a compound form, which can contain up to three corrective patterns.
- The correction is in its second corrective pattern, which is in wave C{-7}, its final wave.
- Wave C{-7}, when complete, will be followed by either a separator wave, X{-7}, and then a third corrective pattern, or will be the end of the wave 2{-6} correction and will be followed by a powerful downtrend, wave 3{-6}.
We Are Here.
These are the waves currently in progress under my principal analysis. Each line on the list shows the wave number, with the subscript in curly brackets, the traditional degree name, the starting date, the starting price of the S&P 500 E-mini futures, and the direction of the wave.
- S&P 500 Index:
- 5{+3} Supercycle, 7/8/1932, 4.40 (up)
- 5{+2} Cycle, 12/9/1974, 60.96 (up)
- 5{+1} Primary, 3/6/2009, 666.79 (up)
- 5{0} Intermediate, 12/26/2018, 2346.58 (up)
- S&P 500 Futures and index:
- 4{-1} Minor, 1/4/2022, 4953.25 (down) (futures), 4818.62 (down) (index)
- S&P 500 Futures:
- 1{-2} Minute, 1/4/2022, 4953.25 (down)
- 1{-3} Minuette, 1/4/2022, 4953.25 (down)
- 1{-4} Subminuette, 1/4/2022, 4953.25 (down)
- 1{-5} Micro, 1/4/2022, 4953.25 (down)
- 2{-6} Minuscule, 10/13/2022, 3577.75 (up)
Learning and other resources. Elliott wave analysis provides context, not prophecy. As the 20th century semanticist Alfred Korzybski put it in his book Science and Sanity (1933), “The map is not the territory … The only usefulness of a map depends on similarity of structure between the empirical world and the map.” And I would add, in the ever-changing markets, we can judge that similarity of structure only after the fact.
See the menu page Analytical Methods for a rundown on where to go for information on Elliott wave analysis.
By Tim Bovee, Portland, Oregon, June 14, 2023
Disclaimer
Tim Bovee, Private Trader tracks the analysis and trades of a private trader for his own accounts. Nothing in this blog constitutes a recommendation to buy or sell stocks, options or any other financial instrument. The only purpose of this blog is to provide education and entertainment.
No trader is ever 100 percent successful in his or her trades. Trading in the stock and option markets is risky and uncertain. Each trader must make trading decisions for his or her own account, and take responsibility for the consequences.
License
All content on Tim Bovee, Private Trader by Timothy K. Bovee is licensed under a Creative Commons Attribution-ShareAlike 4.0 International License.
Based on a work at www.timbovee.com.

You must be logged in to post a comment.