3:30 p.m. New York time
Half an hour before the closing bell. The S&P 500 futures rose rapidly throughout the session, from a low of 4393.75 an hour before the opening bell reaching into the 4480s as the closing bell approached.
No change in the analysis. I’ve updated the chart.
9:35 a.m. New York time
What’s happening now? The S&P 500 E-mini futures pulled back overnight, dipping below the 61.8% Fibonacci retracement level for the second day in a row. The 61.8% retracement neighborhood is a common pause and reversal point in the markets.
What does it mean? The upward correction that began on October 13, 2022 continues. Internally, there are two possible scenarios of equal probability.
- The correction is in its 1st subwave, an A wave, which is nearing its end. The wave labels for this analysis are shown on the chart in black. Under this scenario, the wave is taking the from of a Zigzag, with five subwaves in the A wave.
- The correction is in its final subwave, a C wave within the second corrective pattern of a compound correction, which is nearing sits end. The wave labels for this analysis are in blue.
At this point, there’s no way to choose between them. The A-wave scenario seems to be the clearer count, although the time it has taken seems overly long for an A wave of this degree. The C-wave scenario better matches the time frame and is almost a reasonable reading of the chart patterns as is the A-wave scenario.
The falling wave that follows the present rise will tell us which is the best match for the chart. Under the A-wave scenario, the falling wave, as a B wave, will have three subwaves. Under the C-wave scenario, the falling wave will be the 1st subwave of a powerful downtrend and will have five subwaves.
What are the alternatives? There are two.
Alternative #1, a third corrective pattern. Under the C-wave scenario, the compound correction could add a third corrective pattern, separated from the second pattern by an X-wave having three subwaves.
Alternative #2, a Flat, not a Zigzag. Under the A-wave scenario, it’s possible that the correction is taking the form of a Flat, with three subwaves within the A wave. If so, then the third subwave may have ended at the June 14 peak, 4439.50.
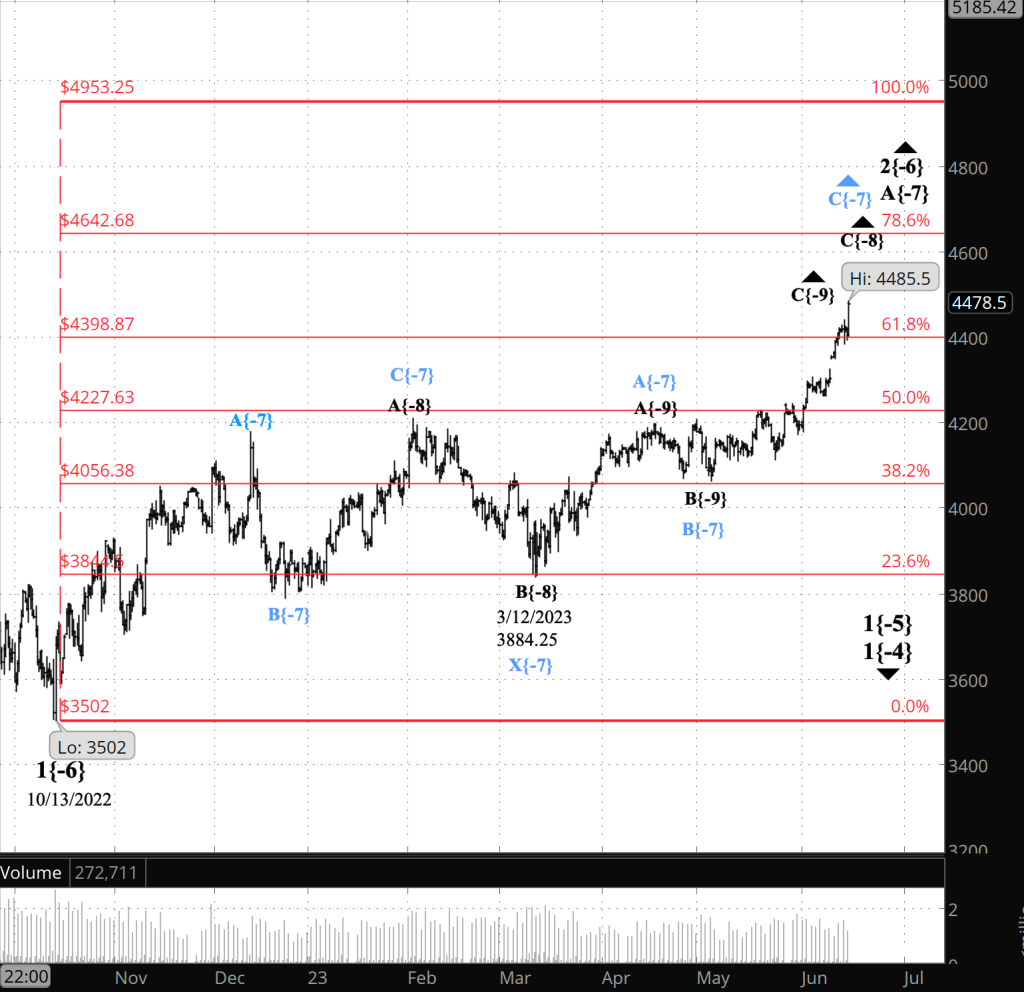
[S&P 500 E-mini futures at 3:30 p.m., 8-hour bars, with volume]
What does Elliott wave theory say? Here are the waves that underly the analyses.
Principal analysis, simple correction (black labeling on the chart):
- An upward correction, a Zigzag, wave 2{-6}, began on October 13, 2022 and is underway.
- The correction’s first subwave, wave A{-7}, is underway and will have five subwaves.
- Wave A{-7} at present is in its 3rd subwave, wave C{-8}.
- Wave C{-8} is in its 3rd subwave, wave C{-9}.
- Wave 2{-6}, when complete, will be followed by a powerful downtrend, wave 3{-6}.
- Under the rules of Elliott wave analysis, wave 2{-6} cannot move beyond the beginning of wave 1{-6}, which was the January 4, 2022 peak at 4953.25. (I’ve adjusted the January 4 peak.)
Principal analysis, compound correction (blue labeling on the chart):
- The upward correction, wave 2{-6}, is taking a compound form, which can contain up to three corrective patterns.
- The correction is in its second corrective pattern, which is in wave C{-7}, its final wave.
- Wave C{-7}, when complete, will be followed by either a separator wave, X{-7}, and then a third corrective pattern, or will be the end of the wave 2{-6} correction and will be followed by a powerful downtrend, wave 3{-6}.
Alternative #1, compound correction, a third corrective pattern.
- Under the scenario marked in blue on the chart, and within the correction, wave 2{-6}…
- Wave C{-7} will be followed by a connecting wave, X{-7}, and then a third corrective pattern, most likely with three subwaves.
- Compound corrections can have no more than three corrective patterns.
Alternative #2, , a Flat, not a Zigzag.
- Under the scenario marked in black on the chart, and within the correction, wave 2{-6}…
- The correction is taking the form of a Flat, and so wave A{-7} will have three subwaves.
- The present subwave, wave A{-8}, will complete wave A[-7}.
We Are Here.
These are the waves currently in progress under my principal analysis. Each line on the list shows the wave number, with the subscript in curly brackets, the traditional degree name, the starting date, the starting price of the S&P 500 E-mini futures, and the direction of the wave.
- S&P 500 Index:
- 5{+3} Supercycle, 7/8/1932, 4.40 (up)
- 5{+2} Cycle, 12/9/1974, 60.96 (up)
- 5{+1} Primary, 3/6/2009, 666.79 (up)
- 5{0} Intermediate, 12/26/2018, 2346.58 (up)
- S&P 500 Futures and index:
- 4{-1} Minor, 1/4/2022, 4953.25 (down) (futures), 4818.62 (down) (index)
- S&P 500 Futures:
- 1{-2} Minute, 1/4/2022, 4953.25 (down)
- 1{-3} Minuette, 1/4/2022, 4953.25 (down)
- 1{-4} Subminuette, 1/4/2022, 4953.25 (down)
- 1{-5} Micro, 1/4/2022, 4953.25 (down)
- 2{-6} Minuscule, 10/13/2022, 3577.75 (up)
Learning and other resources. Elliott wave analysis provides context, not prophecy. As the 20th century semanticist Alfred Korzybski put it in his book Science and Sanity (1933), “The map is not the territory … The only usefulness of a map depends on similarity of structure between the empirical world and the map.” And I would add, in the ever-changing markets, we can judge that similarity of structure only after the fact.
See the menu page Analytical Methods for a rundown on where to go for information on Elliott wave analysis.
By Tim Bovee, Portland, Oregon, June 15, 2023
Disclaimer
Tim Bovee, Private Trader tracks the analysis and trades of a private trader for his own accounts. Nothing in this blog constitutes a recommendation to buy or sell stocks, options or any other financial instrument. The only purpose of this blog is to provide education and entertainment.
No trader is ever 100 percent successful in his or her trades. Trading in the stock and option markets is risky and uncertain. Each trader must make trading decisions for his or her own account, and take responsibility for the consequences.
License
All content on Tim Bovee, Private Trader by Timothy K. Bovee is licensed under a Creative Commons Attribution-ShareAlike 4.0 International License.
Based on a work at www.timbovee.com.

You must be logged in to post a comment.