3:30 p.m. New York time
Half an hour before the closing bell. The S&P 500 futures gradually fell back into the 4450s, a small move compared to the prior day’s rapid rise. No change in this morning’s analysis. I’ve updated the chart.
9:35 a.m. New York time
What’s happening now? The S&P 500 E-mini futures pushed higher overnight into the 4490s, while exceeding yesterday’s session high. The price is about halfway between two Fibonacci levels, the 61.8% retracement and the 78.6% retracement.
What does it mean? The present rise has been underway since May 4, within a much larger upward correction that began in October 2022. There are two ways of counting the waves within the correction, and the significance of the rise since May depends upon which method is used.
Corrections can take a simple form, with one corrective pattern a degree below the correction, or a compound form, with two or three corrective patterns.
Analyzing the correction as a simple form, the correction is nearing the end of its first subwave, to be followed by a decline and then a rise to new highs. Analyzing it as a compound form, the correction is nearing the end of its second corrective pattern and is approaching the end of that pattern.
There’s enough ambiguity in the chart that I consider the two possibilities equally likely. I’ve labeled the subwaves according to the simple correction scenario in black, and the subwaves according to the compound scenario in blue.
Breaking through the ambiguity. One component of Elliott wave theory is how a wave’s comparison in the time it takes to reach completion compared to other waves. The downtrending 1st wave preceding the present 2nd wave correction lasted a bit over 10 months. The present upward 2nd wave correction is now its 8th month. First waves in my experience have tended take a slightly longer time than 2nd waves, although not always. A longer time period for the correction suggests a compound form, a shorter time period, a simple form.
Take-away: The correction is likely almost over and has taken a compound form, since the A wave within the simple form has taken way to long a time to reach completion.
I’ll look into this aspect of the analysis further, but for now, I’m retailing the two wave counts as being equally probable.
What are the alternatives? Under the compound-correction scenario, any high could be the end of the present corrective pattern. The alternatives are either (#1) the high also marks the end of the correction, or (#2) a declining separator wave (X-wave) will be followed by a third corrective pattern.
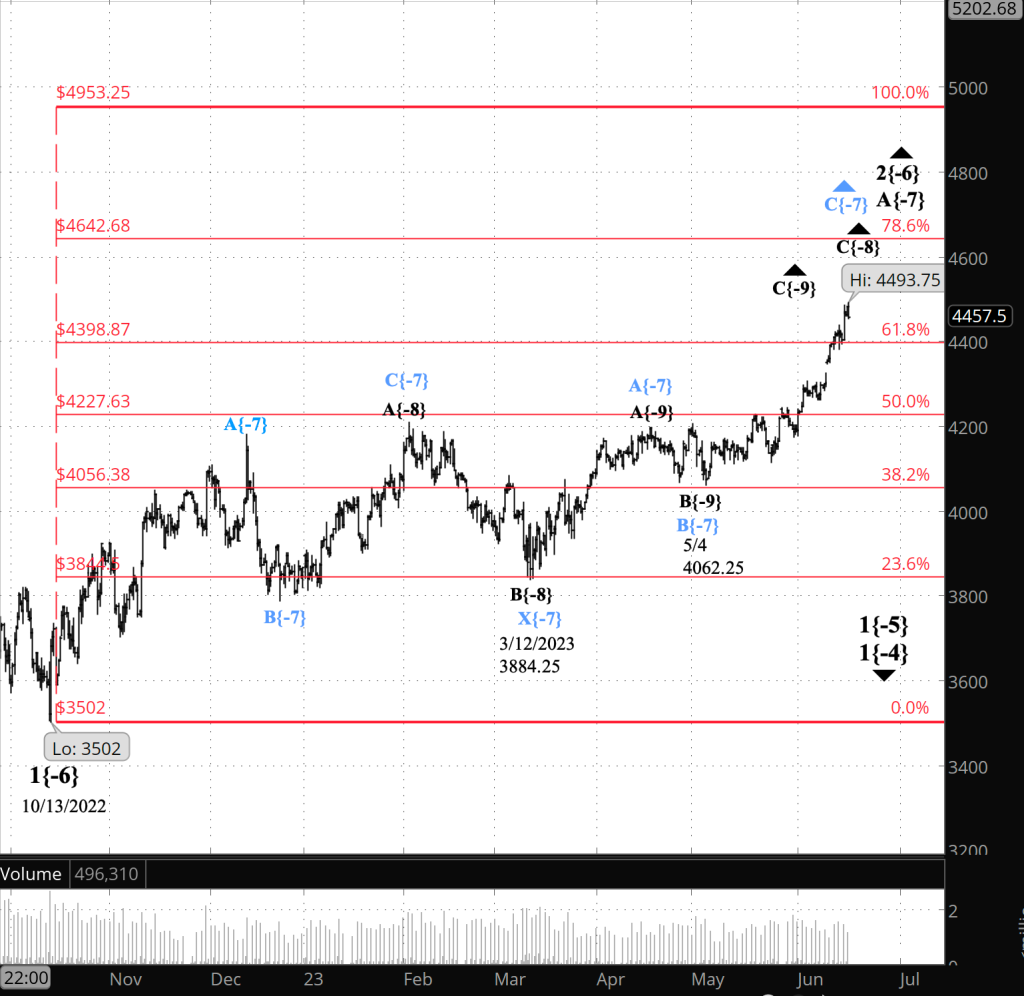
[S&P 500 E-mini futures at 3:30 p\.m., 8-hour bars, with volume]
What does Elliott wave theory say? Here are the waves that underly the analyses.
Principal analysis, simple correction (black labeling on the chart):
- An upward correction, a Zigzag, wave 2{-6}, began on October 13, 2022 and is underway.
- The correction’s first subwave, wave A{-7}, is underway and will have five subwaves.
- Wave A{-7} at present is in its 3rd subwave, wave C{-8}.
- Wave C{-8} is in its 3rd subwave, wave C{-9}.
- Wave 2{-6}, when complete, will be followed by a powerful downtrend, wave 3{-6}.
- Under the rules of Elliott wave analysis, wave 2{-6} cannot move beyond the beginning of wave 1{-6}, which was the January 4, 2022 peak at 4953.25. (I’ve adjusted the January 4 peak.)
Principal analysis, compound correction (blue labeling on the chart):
- The upward correction, wave 2{-6}, is taking a compound form, which can contain up to three corrective patterns.
- The correction is in its second corrective pattern, which is in wave C{-7}, its final wave.
Alternatives, a 3rd corrective pattern or the end of the correction
- Wave C{-7}, when complete, will be followed by either (#1) a separator wave, X{-7}, and then a third corrective pattern, or (#2) will be the end of the wave 2{-6} correction and will be followed by a powerful downtrend, wave 3{-6}.
- Compound corrections can contain no more than three corrective patterns.
Reading the chart. Price movements — waves – – in Elliott wave analysis are labeled with numbers within trending waves and letters with corrective waves. The subscripts — numbers in curly brackets — designate the wave’s degree, which, in Elliott wave analysis, means the relative position of a wave within the larger and smaller structures that make up the chart. R.N. Elliott, who in the 1930s developed the form of analysis that bears his name, viewed the chart as a complex structure of smaller waves nested within larger waves, which in turn are nested within still larger waves. In mathematics it’s called a fractal structure, where at every scale the pattern is similar to the others.
We Are Here.
These are the waves currently in progress under my principal analysis. Each line on the list shows the wave number, with the subscript in curly brackets, the traditional degree name, the starting date, the starting price of the S&P 500 E-mini futures, and the direction of the wave.
- S&P 500 Index:
- 5{+3} Supercycle, 7/8/1932, 4.40 (up)
- 5{+2} Cycle, 12/9/1974, 60.96 (up)
- 5{+1} Primary, 3/6/2009, 666.79 (up)
- 5{0} Intermediate, 12/26/2018, 2346.58 (up)
- S&P 500 Futures and index:
- 4{-1} Minor, 1/4/2022, 4953.25 (down) (futures), 4818.62 (down) (index)
- S&P 500 Futures:
- 1{-2} Minute, 1/4/2022, 4953.25 (down)
- 1{-3} Minuette, 1/4/2022, 4953.25 (down)
- 1{-4} Subminuette, 1/4/2022, 4953.25 (down)
- 1{-5} Micro, 1/4/2022, 4953.25 (down)
- 2{-6} Minuscule, 10/13/2022, 3577.75 (up)
Learning and other resources. Elliott wave analysis provides context, not prophecy. As the 20th century semanticist Alfred Korzybski put it in his book Science and Sanity (1933), “The map is not the territory … The only usefulness of a map depends on similarity of structure between the empirical world and the map.” And I would add, in the ever-changing markets, we can judge that similarity of structure only after the fact.
See the menu page Analytical Methods for a rundown on where to go for information on Elliott wave analysis.
By Tim Bovee, Portland, Oregon, June 16, 2023
Disclaimer
Tim Bovee, Private Trader tracks the analysis and trades of a private trader for his own accounts. Nothing in this blog constitutes a recommendation to buy or sell stocks, options or any other financial instrument. The only purpose of this blog is to provide education and entertainment.
No trader is ever 100 percent successful in his or her trades. Trading in the stock and option markets is risky and uncertain. Each trader must make trading decisions for his or her own account, and take responsibility for the consequences.
License
All content on Tim Bovee, Private Trader by Timothy K. Bovee is licensed under a Creative Commons Attribution-ShareAlike 4.0 International License.
Based on a work at www.timbovee.com.

[…] does it mean? The lack of movement in the price leaves unresolved the ambiguities I described in Friday’s Trader’s Notebook, and I refer the reader to that post for the details, both of the principal analysis and the […]
LikeLike