3:30 p.m. New York time
Half an hour before the closing bell. The S&P 500 futures rose to 4403 in the early hours of the session and then retreated back to the 4370s, trading in a narrow range thereafter, so far. No change in this morning’s analysis. I’ve updated the chart.
9:35 a.m. New York time
What’s happening now? The S&P 500 E-mini futures worked its way lower into the 4370s after trading resumed overnight,
What does it mean? The upward correction that began in mid-October continues and has taken a compound form. It is presently in the final wave of the second corrective pattern, which may be the final pattern. Or, possibly, there could be one more corrective pattern.
That final wave within the second pattern is in the fourth of five subwaves. When complete, that fourth subwave will be followed by a fifth and final wave that will most likely rise above the correction’s previous high, 4493.75, attained on June 16.
What happens after the second corrective pattern is complete? There will be a decline, that will fill one or the other of two very different roles in the Elliott wave structure.
If the compound correction will have two corrective patterns, then the end of the present pattern will also be the end do the correction, and the decline will be a powerful downtrend that will carry the price well below the correction’s starting point, 3502.
If the compound correction will have three corrective patterns, then the downward movement will be a connecting wave that will be followed by the third and final corrective pattern. The connecting wave will be relatively shallow — the first connecting wave within this correction covered only 324 points. The third corrective pattern, when complete, will also be the end of the compound correction, and the powerful downtrend will begin.
Timing: The first corrective pattern took about 3-1/2 months to complete. The second pattern has been underway for almost 3-1/2 months and still has further to go. The prior corrective pattern’s connector wave took a month and a half to complete. So a third corrective pattern, along with the connector wave, could possibly add five months to the lifespan of the correction, bringing it to the end of the year. If the present second corrective pattern completes the correction, then it could be over before autumn begins in the Northern Hemisphere.
However, some waves move fast, others move slow, and past time spans aren’t necessarily accurate indicators of future timespans.
What are the alternatives? I’ve labeled the correction as being of the {-6} degree. Degree labelling is notoriously prone to re-interpretation. It could turn out to be of a larger degree.
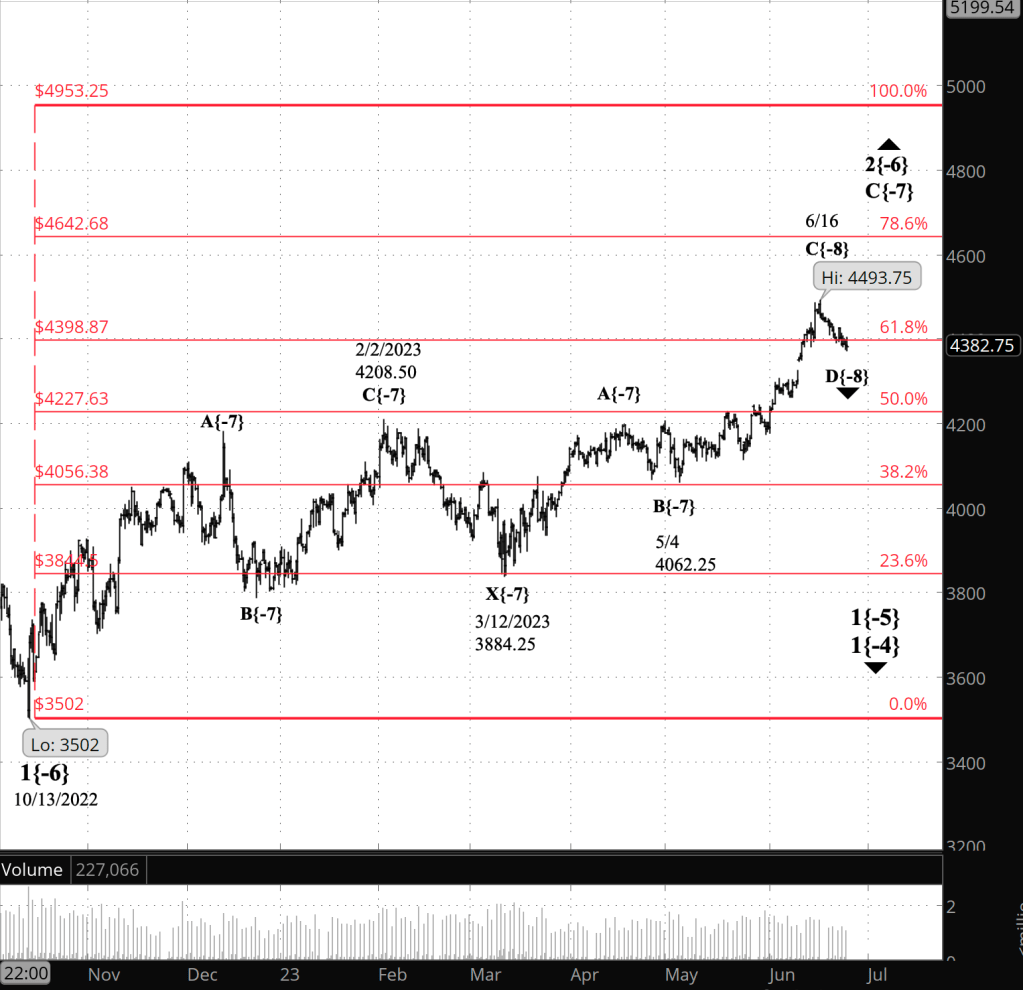
[S&P 500 E-mini futures at 3:30 p.m., 8-hour bars, with volume]
Reading the chart. Price movements — waves – – in Elliott wave analysis are labeled with numbers within trending waves and letters with corrective waves. The subscripts — numbers in curly brackets — designate the wave’s degree, which, in Elliott wave analysis, means the relative position of a wave within the larger and smaller structures that make up the chart. R.N. Elliott, who in the 1930s developed the form of analysis that bears his name, viewed the chart as a complex structure of smaller waves nested within larger waves, which in turn are nested within still larger waves. In mathematics it’s called a fractal structure, where at every scale the pattern is similar to the others.
What does Elliott wave theory say? Here are the waves that underly the analysis.
- An upward correction, a Zigzag, wave 2{-6}, began on October 13, 2022 and is underway.
- The upward correction, wave 2{-6}, is taking a compound form, which can contain up to three corrective patterns.
- The correction is in its second corrective pattern, which is in wave C{-7}, its final wave.
- The end of the present wave C{-7} could also be the end of the wave 2{-6} correction if the compound structure contains two subwaves.
- Or the present corrective pattern could be followed by a declining connector, wave X{-7}, and then a third corrective pattern.
- Wave 2{-6}, when complete, will be followed by a powerful downtrend, wave 3{-6}.
- Under the rules of Elliott wave analysis, wave 2{-6} cannot move beyond the beginning of wave 1{-6}, which was the January 4, 2022 peak at 4953.25. (I’ve adjusted the January 4 peak.)
We Are Here.
These are the waves currently in progress under my principal analysis. Each line on the list shows the wave number, with the subscript in curly brackets, the traditional degree name, the starting date, the starting price of the S&P 500 E-mini futures, and the direction of the wave.
- S&P 500 Index:
- 5{+3} Supercycle, 7/8/1932, 4.40 (up)
- 5{+2} Cycle, 12/9/1974, 60.96 (up)
- 5{+1} Primary, 3/6/2009, 666.79 (up)
- 5{0} Intermediate, 12/26/2018, 2346.58 (up)
- S&P 500 Futures and index:
- 4{-1} Minor, 1/4/2022, 4953.25 (down) (futures), 4818.62 (down) (index)
- S&P 500 Futures:
- 1{-2} Minute, 1/4/2022, 4953.25 (down)
- 1{-3} Minuette, 1/4/2022, 4953.25 (down)
- 1{-4} Subminuette, 1/4/2022, 4953.25 (down)
- 1{-5} Micro, 1/4/2022, 4953.25 (down)
- 2{-6} Minuscule, 10/13/2022, 3577.75 (up)
Learning and other resources. Elliott wave analysis provides context, not prophecy. As the 20th century semanticist Alfred Korzybski put it in his book Science and Sanity (1933), “The map is not the territory … The only usefulness of a map depends on similarity of structure between the empirical world and the map.” And I would add, in the ever-changing markets, we can judge that similarity of structure only after the fact.
See the menu page Analytical Methods for a rundown on where to go for information on Elliott wave analysis.
By Tim Bovee, Portland, Oregon, June 26, 2023
Disclaimer
Tim Bovee, Private Trader tracks the analysis and trades of a private trader for his own accounts. Nothing in this blog constitutes a recommendation to buy or sell stocks, options or any other financial instrument. The only purpose of this blog is to provide education and entertainment.
No trader is ever 100 percent successful in his or her trades. Trading in the stock and option markets is risky and uncertain. Each trader must make trading decisions for his or her own account, and take responsibility for the consequences.
License
All content on Tim Bovee, Private Trader by Timothy K. Bovee is licensed under a Creative Commons Attribution-ShareAlike 4.0 International License.
Based on a work at www.timbovee.com.

You must be logged in to post a comment.