U.S. markets schedule. Tomorrow, July 4, is a major holiday in the United States, celebrating its declaration of independence from the British Empire. U.S. markets will close early today, at 1 p.m. New York time, and will be closed tomorrow. The London and Tokyo markets traded today and will trade tomorrow. Today’s final update of Trader’s Notebook will be posted half an hour before the close, at 12:30 p.m. New York time.
12:30 p.m. New York time
Half an hour before the closing bell. The S&P 500 futures has so far remained within the overnight range during the abbreviated session, rising from the 4470s back into the 4490s. No change in the analysis. I’ve updated the chart.
9:35 a.m. New York time
What’s happening now? The S&P 500 E-mini futures traded sideways overnight, peaked after 12 hours at 4493.25 and then quickly dropped, reaching into the 4470s as the opening bell sounded.
What does it mean? The question with which I closed the week on Friday remains unanswered: Is the rise that began on June 6 is the final subwave within the rising final wave of a corrective pattern, or is it an upward movement within the falling next-to-the-last subwave.
I’ve chosen to mark the chart with the scenario that the final subwave is underway as being the slightly more likely choice
In either case, the upward compound correction that began on October 13, 2022 continues and is in the last leg of its second corrective pattern. When the second pattern is complete, the price will either fall deeply in a downtrend, or will fall less dramatically in a linking wave that will be followed by a third corrective pattern, which when complete will be the end of the upward correction.
What are the alternatives? As is common, there is some ambiguity as to the relative degree of the correction. I’ve marked it as {-6} — Minuscule Degree in traditional Elliott wave terminology — but it could be larger.
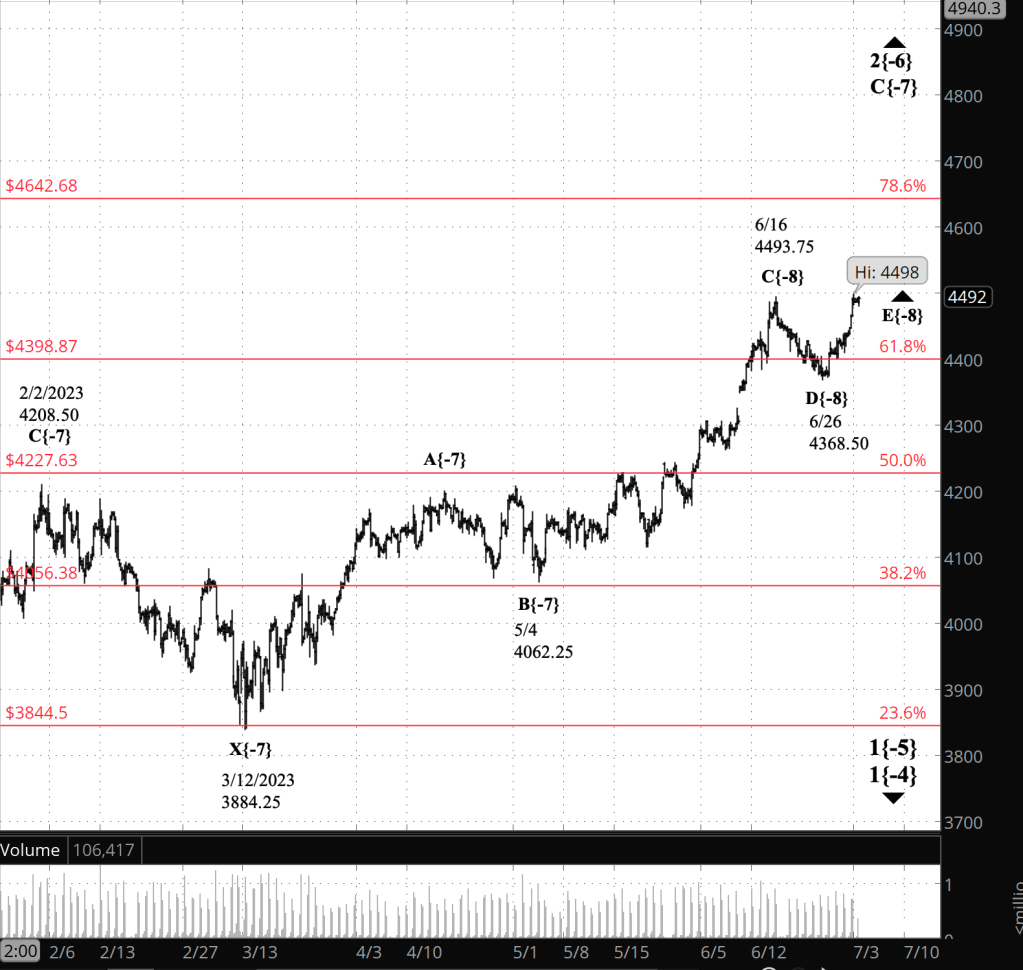
[S&P 500 E-mini futures at 12:30 p.m., 4-hour bars, with volume]
What does Elliott wave theory say? Here are the waves that underly the analysis.
- An upward correction, a Zigzag, wave 2{-6}, began on October 13, 2022 and is underway.
- The upward correction, wave 2{-6}, is taking a compound form, which can contain up to three corrective patterns.
- The correction is in its second corrective pattern, which is in wave C{-7}, its final wave.
- The end of the present wave C{-7} could also be the end of the wave 2{-6} correction if the compound structure contains two subwaves.
- Or the present corrective pattern could be followed by a declining connector, wave X{-7}, and then a third corrective pattern.
- Wave 2{-6}, when complete, will be followed by a powerful downtrend, wave 3{-6}.
- Under the rules of Elliott wave analysis, wave 2{-6} cannot move beyond the beginning of wave 1{-6}, which was the January 4, 2022 peak at 4953.25. (I’ve adjusted the January 4 peak.)
We Are Here.
These are the waves currently in progress under my principal analysis. Each line on the list shows the wave number, with the subscript in curly brackets, the traditional degree name, the starting date, the starting price of the S&P 500 E-mini futures, and the direction of the wave.
- S&P 500 Index:
- 5{+3} Supercycle, 7/8/1932, 4.40 (up)
- 5{+2} Cycle, 12/9/1974, 60.96 (up)
- 5{+1} Primary, 3/6/2009, 666.79 (up)
- 5{0} Intermediate, 12/26/2018, 2346.58 (up)
- S&P 500 Futures and index:
- 4{-1} Minor, 1/4/2022, 4953.25 (down) (futures), 4818.62 (down) (index)
- S&P 500 Futures:
- 1{-2} Minute, 1/4/2022, 4953.25 (down)
- 1{-3} Minuette, 1/4/2022, 4953.25 (down)
- 1{-4} Subminuette, 1/4/2022, 4953.25 (down)
- 1{-5} Micro, 1/4/2022, 4953.25 (down)
- 2{-6} Minuscule, 10/13/2022, 3577.75 (up)
Learning and other resources. Elliott wave analysis provides context, not prophecy. As the 20th century semanticist Alfred Korzybski put it in his book Science and Sanity (1933), “The map is not the territory … The only usefulness of a map depends on similarity of structure between the empirical world and the map.” And I would add, in the ever-changing markets, we can judge that similarity of structure only after the fact.
See the menu page Analytical Methods for a rundown on where to go for information on Elliott wave analysis.
By Tim Bovee, Portland, Oregon, July 3, 2023
Disclaimer
Tim Bovee, Private Trader tracks the analysis and trades of a private trader for his own accounts. Nothing in this blog constitutes a recommendation to buy or sell stocks, options or any other financial instrument. The only purpose of this blog is to provide education and entertainment.
No trader is ever 100 percent successful in his or her trades. Trading in the stock and option markets is risky and uncertain. Each trader must make trading decisions for his or her own account, and take responsibility for the consequences.
License
All content on Tim Bovee, Private Trader by Timothy K. Bovee is licensed under a Creative Commons Attribution-ShareAlike 4.0 International License.
Based on a work at www.timbovee.com.

You must be logged in to post a comment.