3:30 p.m. New York time
Half an hour before the closing bell. The S&P 500 futures fell during the session, from the 4480s to a low of 4419.50. It then reversed, reaching back into the 4450s. The smallest wave I’m tracking, wave D{-9}, is the next to the last wave within the fifth wave, E{-8}, of the last wave, C{-7}, within the second corrective pattern within the long-running upward correction, wave 2{-6}.
Wave D{-9} will have three subwaves, and by my count, the session low is the end of the third subwave, wave C{-10}. If that’s the case, wave D{-9} has ended and wave E{-9} is underway. However, it’s also possible that the rise following the session low is a subwave of wave D{-9}, which still has a bit more downside left.
Here’s a close-up chart showing the pattern.

[S&P 500 E-mini futures at 3:15 p.m., 20-minute bars]
For now, I’m leaving the analysis as it was this morning: Wave D{-9} is still underway. I’ll revisit the issue in tomorrow morning’s post, after seeing what the overnight trading and early session trading looks like. I’ve updated this morning’s chart, below.
9:35 a.m. New York time
What’s happening now? The S&P 500 E-mini futures declined overnight, beginning in the 4470s and reaching the 4435 shortly after the opening bell.
What does it mean? The upward compound correction that began on October 13, 2022 continues to work through the end game of its second corrective pattern.
The second corrective patten, when complete, will either be followed by a powerful decline back to the starting point of the upward correction and likely much lower, or will have shallow declining wave that will link the second corrective pattern to a third corrective pattern. A compound correction can have no more than three corrective patterns.
What are the alternatives? There is some ambiguity as to the relative degree of the correction — a not unusual situation. I’ve marked it as {-6} — Minuscule Degree in traditional Elliott wave terminology — but it could be larger. (See the “Reading the chart” section, below, for an explanation of how I designate wave degrees on the chart.)
How much larger? To get an idea of what’s “normal” in wave duration, I turned to the S&P 500 index chart and tracked the waves within the uptrend that has been underway since December 2018.
The present top wave of the movement is wave 5{0}, a downtrend that has so far lasted 4.5 years. The preceding 3rd wave, wave 3{0}, lasted about 3.8 years. The other waves are far shorter.
That makes a good case for my degree labeling to be far smaller than chart would imply. On the other hand, there is lot of variety in size and duration among waves of the same degree. So it’s a complex problem, and figuring it out will be a project for the weekend, and I’ll report back on Monday.
Reading the chart. Price movements — waves – – in Elliott wave analysis are labeled with numbers within trending waves and letters with corrective waves. The subscripts — numbers in curly brackets — designate the wave’s degree, which, in Elliott wave analysis, means the relative position of a wave within the larger and smaller structures that make up the chart. R.N. Elliott, who in the 1930s developed the form of analysis that bears his name, viewed the chart as a complex structure of smaller waves nested within larger waves, which in turn are nested within still larger waves. In mathematics it’s called a fractal structure, where at every scale the pattern is similar to the others.
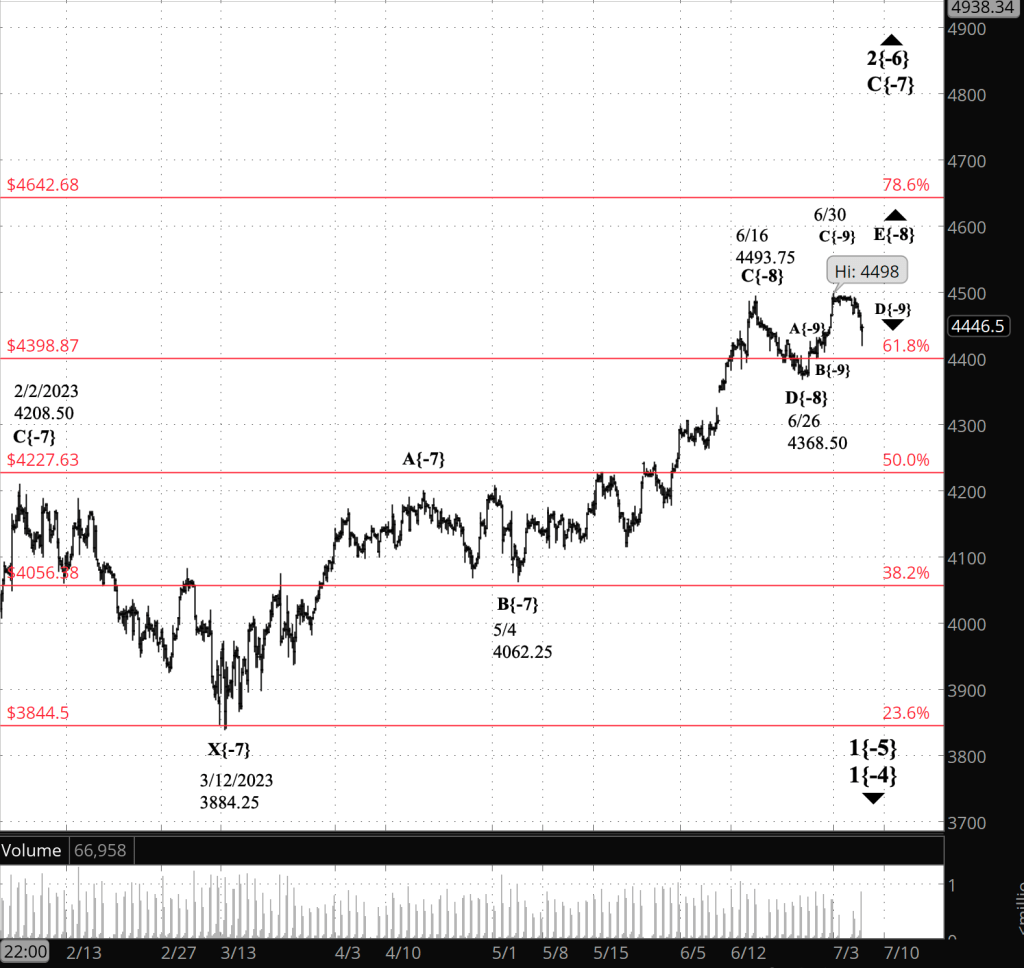
[S&P 500 E-mini futures at 3:30 p.m., 4-hour bars, with volume]
What does Elliott wave theory say? Here are the waves that underly the analysis.
- An upward correction, a Zigzag, wave 2{-6}, began on October 13, 2022 and is underway.
- The upward correction, wave 2{-6}, is taking a compound form, which can contain up to three corrective patterns.
- The correction is in its second corrective pattern, which is in wave C{-7}, its final wave.
- The end of the present wave C{-7} could also be the end of the wave 2{-6} correction if the compound structure contains two subwaves.
- Or the present corrective pattern could be followed by a declining connector, wave X{-7}, and then a third corrective pattern.
- Wave C{-7} will have five subwaves and is in wave E{-8}, the final subwave.
- Wave E{-8} will also have five subwaves and is in wave D{-9}, the fourth of the set.
- Wave 2{-6}, when complete, will be followed by a powerful downtrend, wave 3{-6}.
- Under the rules of Elliott wave analysis, wave 2{-6} cannot move beyond the beginning of wave 1{-6}, which was the January 4, 2022 peak at 4953.25. (I’ve adjusted the January 4 peak.)
We Are Here.
These are the waves currently in progress under my principal analysis. Each line on the list shows the wave number, with the subscript in curly brackets, the traditional degree name, the starting date, the starting price of the S&P 500 E-mini futures, and the direction of the wave.
- S&P 500 Index:
- 5{+3} Supercycle, 7/8/1932, 4.40 (up)
- 5{+2} Cycle, 12/9/1974, 60.96 (up)
- 5{+1} Primary, 3/6/2009, 666.79 (up)
- 5{0} Intermediate, 12/26/2018, 2346.58 (up)
- S&P 500 Futures and index:
- 4{-1} Minor, 1/4/2022, 4953.25 (down) (futures), 4818.62 (down) (index)
- S&P 500 Futures:
- 1{-2} Minute, 1/4/2022, 4953.25 (down)
- 1{-3} Minuette, 1/4/2022, 4953.25 (down)
- 1{-4} Subminuette, 1/4/2022, 4953.25 (down)
- 1{-5} Micro, 1/4/2022, 4953.25 (down)
- 2{-6} Minuscule, 10/13/2022, 3577.75 (up)
Learning and other resources. Elliott wave analysis provides context, not prophecy. As the 20th century semanticist Alfred Korzybski put it in his book Science and Sanity (1933), “The map is not the territory … The only usefulness of a map depends on similarity of structure between the empirical world and the map.” And I would add, in the ever-changing markets, we can judge that similarity of structure only after the fact.
See the menu page Analytical Methods for a rundown on where to go for information on Elliott wave analysis.
By Tim Bovee, Portland, Oregon, July 6, 2023
Disclaimer
Tim Bovee, Private Trader tracks the analysis and trades of a private trader for his own accounts. Nothing in this blog constitutes a recommendation to buy or sell stocks, options or any other financial instrument. The only purpose of this blog is to provide education and entertainment.
No trader is ever 100 percent successful in his or her trades. Trading in the stock and option markets is risky and uncertain. Each trader must make trading decisions for his or her own account, and take responsibility for the consequences.
License
All content on Tim Bovee, Private Trader by Timothy K. Bovee is licensed under a Creative Commons Attribution-ShareAlike 4.0 International License.
Based on a work at www.timbovee.com.

[…] are the alternatives? In the July 6 Trader’s Notebook, I discussed evidence suggesting that placing the 2nd wave correction in the {-6} degree was […]
LikeLike