3:30 p.m. New York time
Half an hour before the closing bell. The S&P 500 futures continued to rise during the session, reaching into the 4540s. No change in the analysis. I’ve updated the chart.
9:35 a.m. New York time
What’s happening now? The S&P 500 E-mini futures rose overnight, from just below 4510 into the 4520s.
What does it mean? The wave in play all week has been the third of five subwaves within the larger final wave within the last leg of the second corrective pattern within the upward correction that began nine months ago today.
That’s a complex structure of waves within waves, so let’s pick it apart. Each wave is numbered, with its degree indicated by a subscript in curly brackets. The smaller the degree number, the further down the hierarchy of waves that specific degree is.
The upward correction, wave 2{-2}, has taken a compound form and is nearing the end of its second corrective pattern.
That second pattern is in its rising third wave, C{-3}, which will be its last.
The rising third wave will have five subwaves and is now in the last subwave, rising wave E{-4}.
And that last wave is in its third of five subwaves, rising wave C{-5}.
So it’s the {-5} degree that’s in place. Wave C{-5} will be followed by declining wave D{-5} and then a final push to the upside with wave E{-5}.
The end of wave E{-5} will also be the end of three levels of increasingly larger waves: E{-4}, C{-3} and the corrective pattern within wave 2{-2}.
It might also be the end of the correction itself, but not necessarily. A compound correction can contain two or three corrective patterns.
If this correction is limited to two patterns, then the end of wave E{-5} will also be the end of the correction, and a powerful downtrend, wave 3{-2}, will begin.
If the correction moves on to a third corrective pattern, then the correction will continue for awhile longer. How much longer? The first pattern took 112 days to reach completion — a bit less than four months. The still incomplete second pattern so far has run for 123 days — a bit more than four months. So it’s possible, although not guaranteed, that a third pattern could carry the correction into winter.
There is an upper limit on how high the upward correction can rise. It is the starting point of the preceding first wave, 1{-2}, which began on January 4, 2022 from 4953.25. A move above that level would invalidate the present analysis and require a re-analysis.
What are the alternatives? None at the present. I’m quite certain that ambiguities will develop over the days and weeks to come.
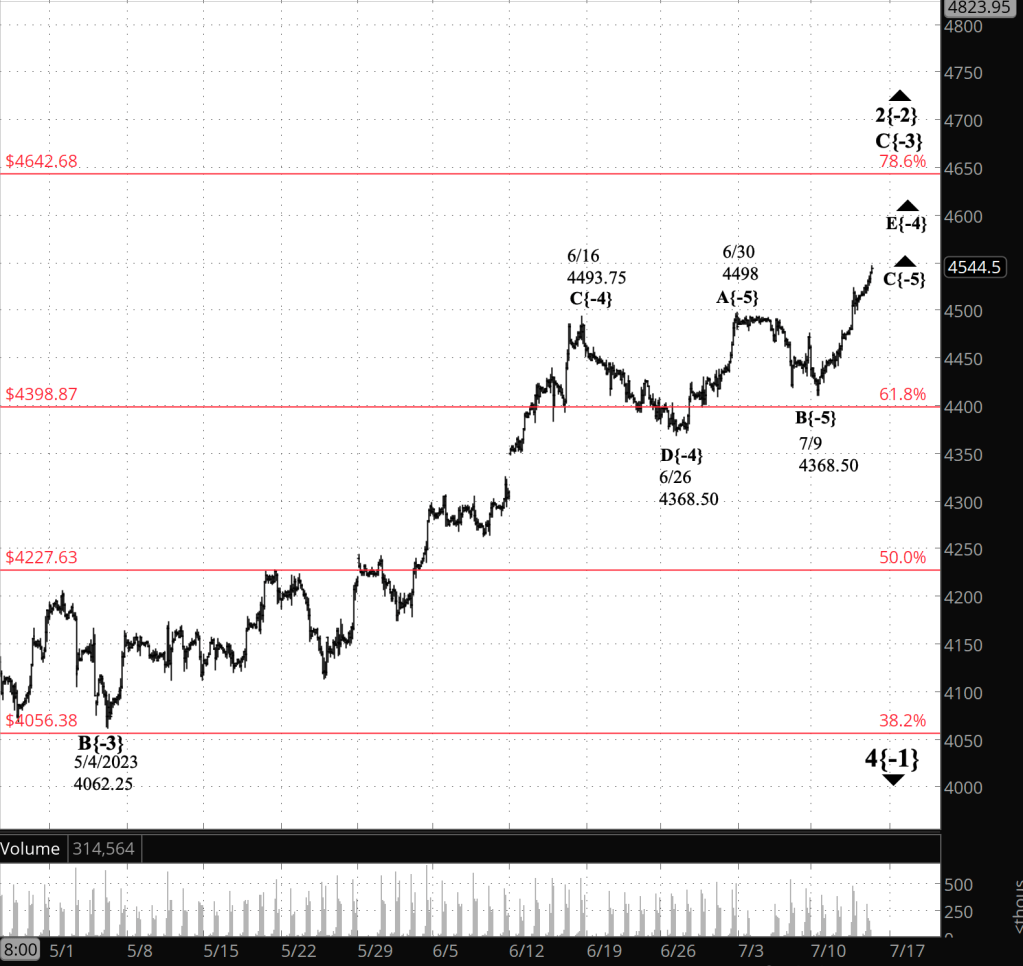
[S&P 500 E-mini futures at 3:30 p.m., 2-hour bars, with volume]
What does Elliott wave theory say? Here are the waves that underly the analysis.
- An upward correction, a Zigzag, wave 2{-2}, began on October 13, 2022 and is underway.
- The upward correction, wave 2{-2}, is taking a compound form, which can contain up to three corrective patterns.
- The correction is in its second corrective pattern, which is in wave C{-3}, its final wave.
- The end of the present wave C{-3} could also be the end of the wave 2{-2} correction if the compound structure contains two subwaves.
- Or the present corrective pattern could be followed by a declining connector, wave X{-3}, and then a third corrective pattern.
- Wave C{-3} will have five subwaves and is at wave E{-4}, the final subwave.
- Wave E{-4} is in its third of five subwaves, wave C{-5}.
- Wave 2{-2}, when complete, will be followed by a powerful downtrend, wave 3{-2}.
- Under the rules of Elliott wave analysis, wave 2{-2} cannot move beyond the beginning of wave 1{-2}, which was the January 4, 2022 peak at 4953.25
We Are Here.
These are the waves currently in progress under my principal analysis. Each line on the list shows the wave number, with the subscript in curly brackets, the traditional degree name, the starting date, the starting price of the S&P 500 E-mini futures, and the direction of the wave.
- S&P 500 Index:
- 5{+3} Supercycle, 7/8/1932, 4.40 (up)
- 5{+2} Cycle, 12/9/1974, 60.96 (up)
- 5{+1} Primary, 3/6/2009, 666.79 (up)
- 5{0} Intermediate, 12/26/2018, 2346.58 (up)
- S&P 500 Futures and index:
- 4{-1} Minor, 1/4/2022, 4953.25 (down) (futures), 4818.62 (down) (index)
- S&P 500 Futures:
- 2{-2} Minute, 10/13/2022, 3577.75 (up)
Reading the chart. Price movements — waves – – in Elliott wave analysis are labeled with numbers within trending waves and letters with corrective waves. The subscripts — numbers in curly brackets — designate the wave’s degree, which, in Elliott wave analysis, means the relative position of a wave within the larger and smaller structures that make up the chart. R.N. Elliott, who in the 1930s developed the form of analysis that bears his name, viewed the chart as a complex structure of smaller waves nested within larger waves, which in turn are nested within still larger waves. In mathematics it’s called a fractal structure, where at every scale the pattern is similar to the others.
Learning and other resources. Elliott wave analysis provides context, not prophecy. As the 20th century semanticist Alfred Korzybski put it in his book Science and Sanity (1933), “The map is not the territory … The only usefulness of a map depends on similarity of structure between the empirical world and the map.” And I would add, in the ever-changing markets, we can judge that similarity of structure only after the fact.
See the menu page Analytical Methods for a rundown on where to go for information on Elliott wave analysis.
By Tim Bovee, Portland, Oregon, July 13, 2023
Disclaimer
Tim Bovee, Private Trader tracks the analysis and trades of a private trader for his own accounts. Nothing in this blog constitutes a recommendation to buy or sell stocks, options or any other financial instrument. The only purpose of this blog is to provide education and entertainment.
No trader is ever 100 percent successful in his or her trades. Trading in the stock and option markets is risky and uncertain. Each trader must make trading decisions for his or her own account, and take responsibility for the consequences.
License
All content on Tim Bovee, Private Trader by Timothy K. Bovee is licensed under a Creative Commons Attribution-ShareAlike 4.0 International License.
Based on a work at www.timbovee.com.

You must be logged in to post a comment.