Trading rule update. Over the weekend I updated my rule set for trading long options and posted a discussion of the changes.
3:30 p.m. New York time
Half an hour before the closing bell. The S&P 500 futures rose above 4560.50, invalidating this morning’s principle analysis and validating the alternative: Wave E{-4}, is still in its middle wave, rising wave C{-5}.
I’ve updated the lower chart, which gives a view of the whole final wave of the present corrective pattern, wave C{-3}.
9:35 a.m. New York time
What’s happening now? The S&P 500 E-mini futures rose after trading resumed overnight, reaching 4539.25 and then falling into the 4520s.
What does it mean? The upward compound correction that began in October is nearing the end of its second corrective pattern, which will be followed either by a connecting wave and a third corrective pattern, or by a powerful downtrend following the end of the correction.
In the terminology used to mark the chart, the upward correction is wave 2{-2}. It is in its final leg, wave C{-3}, which is in its final subwave, E{-4}.
Wave E{-4} will have five subwaves and is in its fourth, wave D{-5}., which will be followed by a final push upward that will end the pattern.
Following is a close-up chart showing the subwaves of wave C{-5}
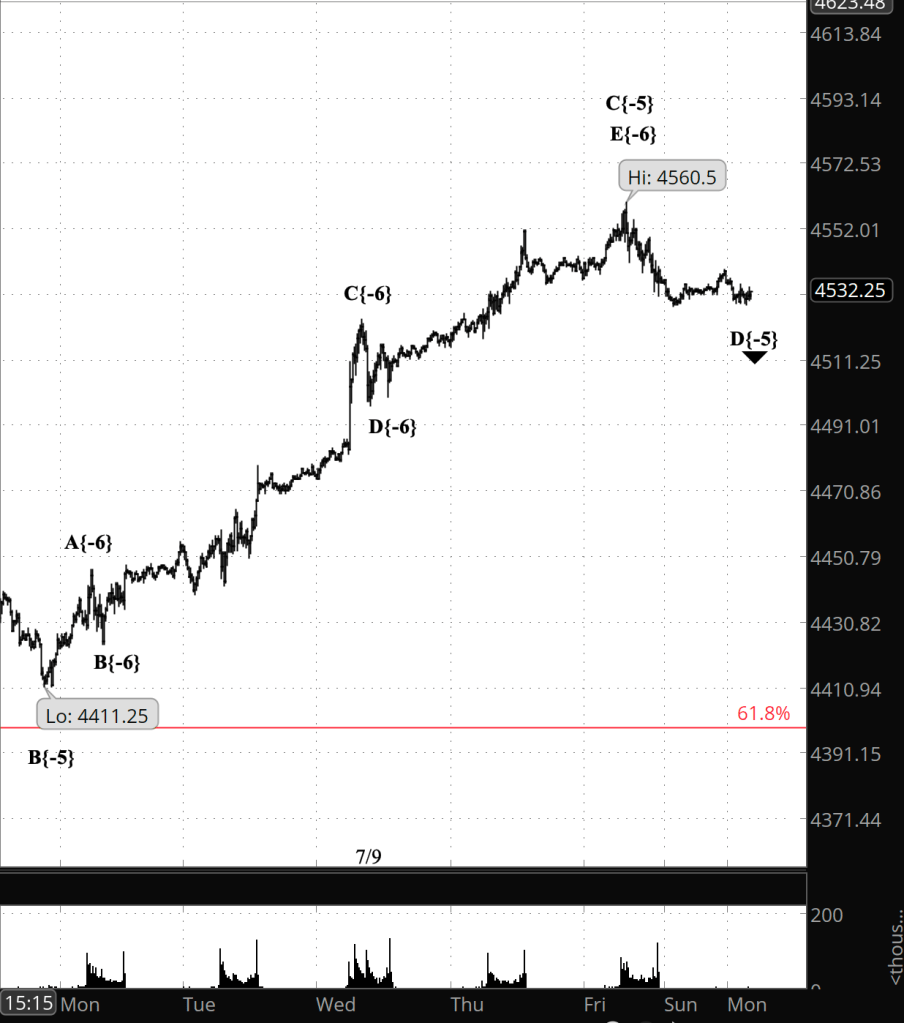
[S&P 500 E-mini futures at 8:59 a.m., 15-minute bars, with volume]
The neighborhood of the 78.6% Fibonacci retracement level — the topmost red line Fibonacci ladder — would be a typical ending point for the final subwave, E{-5}. No guarantees — Fibonacci reversals are tendencies, not certainties
Reading the chart. Price movements — waves – – in Elliott wave analysis are labeled with numbers within trending waves and letters with corrective waves. The subscripts — numbers in curly brackets — designate the wave’s degree, which, in Elliott wave analysis, means the relative position of a wave within the larger and smaller structures that make up the chart. R.N. Elliott, who in the 1930s developed the form of analysis that bears his name, viewed the chart as a complex structure of smaller waves nested within larger waves, which in turn are nested within still larger waves. In mathematics it’s called a fractal structure, where at every scale the pattern is similar to the others.
What are the alternatives? It’s possible that the decline from Friday’s peak is a subwave within an ongoing wave C{-5}. I consider it to be the less likely interpretation.
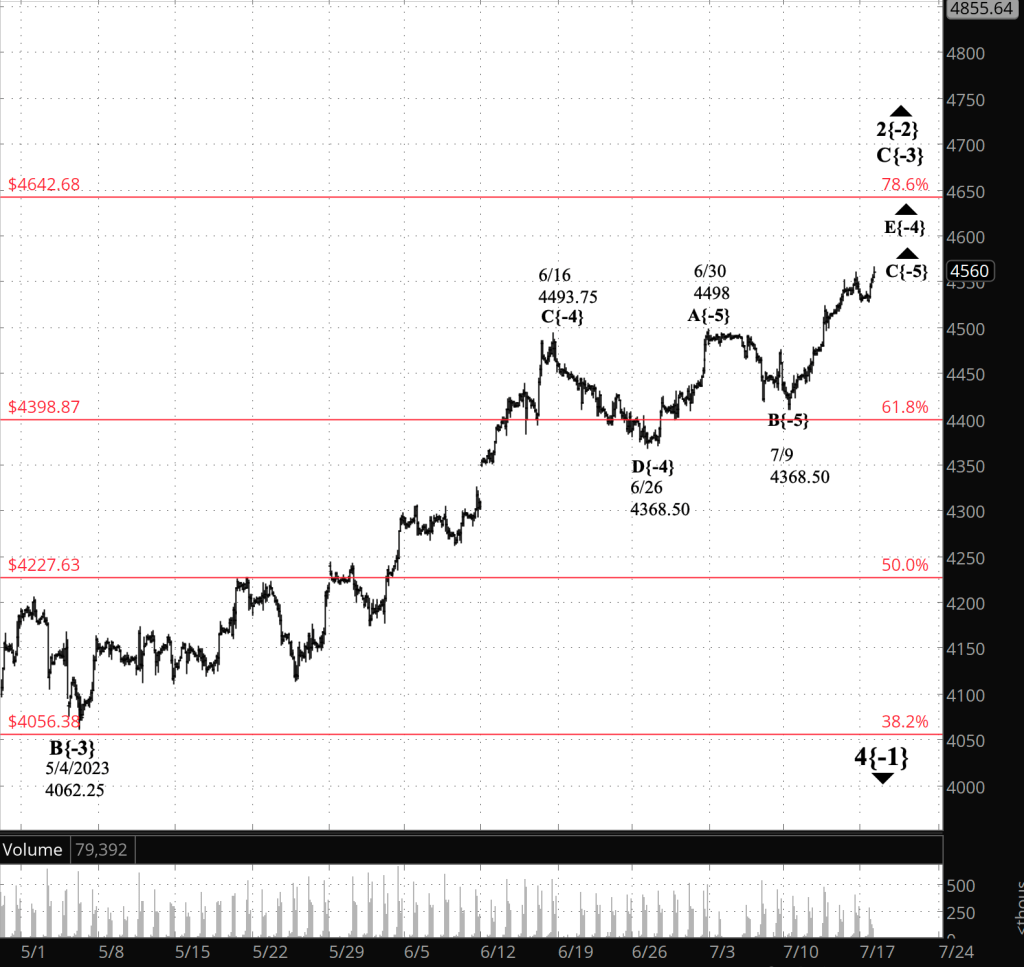
[S&P 500 E-mini futures at 3:31 p.m., 2-hour bars, with volume]
What does Elliott wave theory say? Here are the waves that underly the analysis.
Principal analysis:
- An upward correction, a Zigzag, wave 2{-2}, began on October 13, 2022 and is underway.
- The upward correction, wave 2{-2}, is taking a compound form, which can contain up to three corrective patterns.
- The correction is in its second corrective pattern, which is in wave C{-3}, its final wave.
- The end of the present wave C{-3} could also be the end of the wave 2{-2} correction if the compound structure contains two subwaves.
- Or the present corrective pattern could be followed by a declining connector, wave X{-3}, and then a third corrective pattern.
- Wave C{-3} will have five subwaves and is at wave E{-4}, the final subwave.
- Wave E{-4} is in its fourth of five subwaves, wave D{-5}.
- Wave 2{-2}, when complete, will be followed by a powerful downtrend, wave 3{-2}.
- Under the rules of Elliott wave analysis, wave 2{-2} cannot move beyond the beginning of wave 1{-2}, which was the January 4, 2022 peak at 4953.25
Alternative analysis:
- Wave E{-4} is in its third of five subwaves, wave C{-5}, which will be followed by a declining wave D{-5} and then an upward push to completion
We Are Here.
These are the waves currently in progress under my principal analysis. Each line on the list shows the wave number, with the subscript in curly brackets, the traditional degree name, the starting date, the starting price of the S&P 500 E-mini futures, and the direction of the wave.
- S&P 500 Index:
- 5{+3} Supercycle, 7/8/1932, 4.40 (up)
- 5{+2} Cycle, 12/9/1974, 60.96 (up)
- 5{+1} Primary, 3/6/2009, 666.79 (up)
- 5{0} Intermediate, 12/26/2018, 2346.58 (up)
- S&P 500 Futures and index:
- 4{-1} Minor, 1/4/2022, 4953.25 (down) (futures), 4818.62 (down) (index)
- S&P 500 Futures:
- 2{-2} Minute, 10/13/2022, 3577.75 (up)
Learning and other resources. Elliott wave analysis provides context, not prophecy. As the 20th century semanticist Alfred Korzybski put it in his book Science and Sanity (1933), “The map is not the territory … The only usefulness of a map depends on similarity of structure between the empirical world and the map.” And I would add, in the ever-changing markets, we can judge that similarity of structure only after the fact.
See the menu page Analytical Methods for a rundown on where to go for information on Elliott wave analysis.
By Tim Bovee, Portland, Oregon, July 17, 2023
Disclaimer
Tim Bovee, Private Trader tracks the analysis and trades of a private trader for his own accounts. Nothing in this blog constitutes a recommendation to buy or sell stocks, options or any other financial instrument. The only purpose of this blog is to provide education and entertainment.
No trader is ever 100 percent successful in his or her trades. Trading in the stock and option markets is risky and uncertain. Each trader must make trading decisions for his or her own account, and take responsibility for the consequences.
License
All content on Tim Bovee, Private Trader by Timothy K. Bovee is licensed under a Creative Commons Attribution-ShareAlike 4.0 International License.
Based on a work at www.timbovee.com.

You must be logged in to post a comment.