3:30 p.m. New York time
Half an hour before the closing bell. The S&P 500 futures have hit a session high, so far, of 4609.25, which is also a high for the upward correction that began on October 13, 2022. No change in the analysis. I’ve updated the chart.
9:35 a.m. New York time
What’s happening now? The S&P 500 E-mini futures tracked sideways overnight, remaining within the 4580s and 4590s.
What does it mean? The trip to nowhere was a low-degree pause in the rise that began on July 9, part of the final portion of the second corrective pattern within a long-running upward compound correction that has defined the market for nine months.
As the opening bell approached, the price broke past yesterday’s peak, 4594.50 and in the first few minutes of the session reached higher, to 4603. Any higher high continues the last leg of the corrective pattern. Alternatively, any high is potentially the end of the corrective pattern.
Could a high also be the end of the correction itself? Maybe. A compound correction can have up to three corrective patterns, so it’s possible that the present second pattern will be followed by a shallow decline that will connect that pattern to the future third pattern. And it’s also possible that the second pattern will the end of the correction, setting off a powerful decline that will care the price below 3502, where the correction began, and typically far below that level.
What are the alternatives? All of the above. There is no way to know at this point how many corrective patterns the compound correction will produce. And there’s no way to pinpoint the final high with any degree of certainty. As the stand-up comedian Emo Phillips once defined it, “Ambiguity — the Devil’s volleyball.” Analyzing this market, it certainly seems that way.
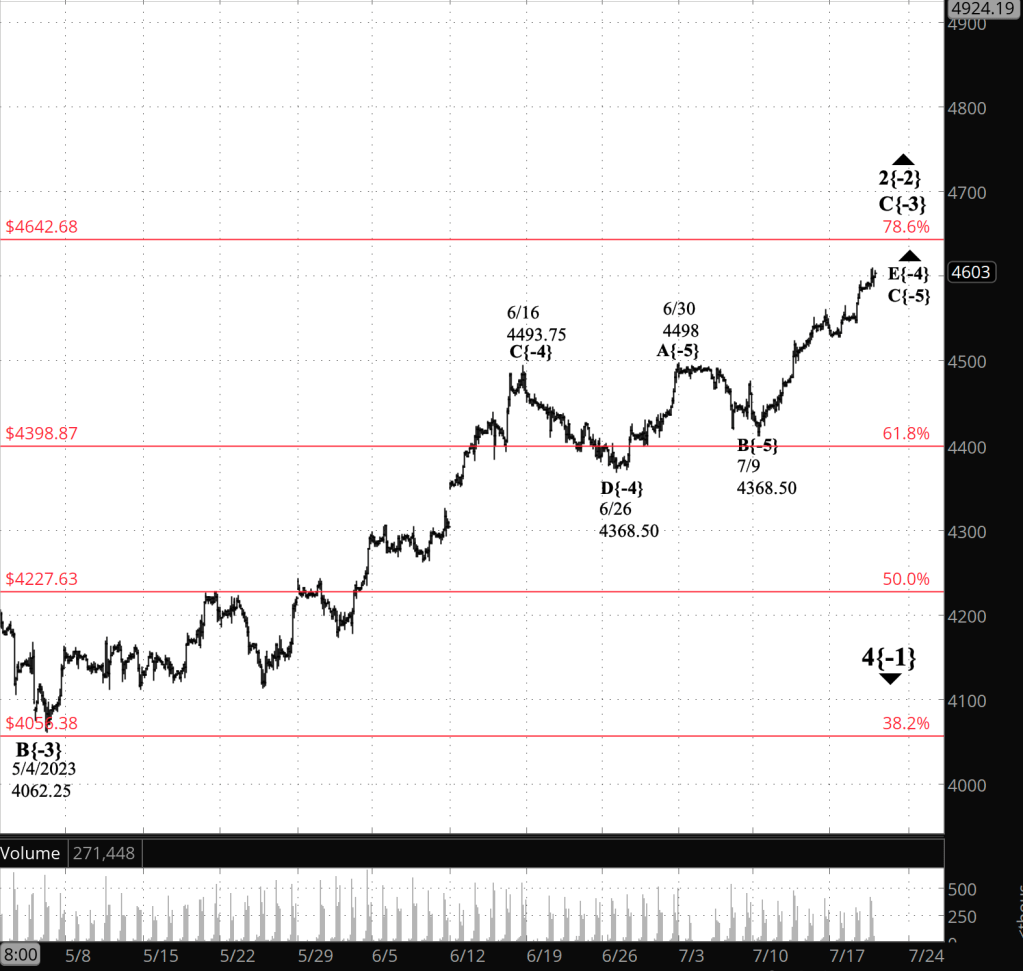
[S&P 500 E-mini futures at 3:30 p.m., 2-hour bars, with volume]
What does Elliott wave theory say? Here are the waves that underly the analysis.
Principal analysis:
- An upward correction, a Zigzag, wave 2{-2}, began on October 13, 2022 and is underway.
- The upward correction, wave 2{-2}, is taking a compound form, which can contain up to three corrective patterns.
- The correction is in its second corrective pattern, which is in wave C{-3}, its final wave.
- The end of the present wave C{-3} could also be the end of the wave 2{-2} correction if the compound structure contains two subwaves.
- Or the present corrective pattern could be followed by a declining connector, wave X{-3}, and then a third corrective pattern.
- Wave C{-3} will have five subwaves and is at wave E{-4}, the final subwave.
- Wave E{-4} is in its third of five subwaves, wave C{-5}.
- Wave 2{-2}, when complete, will be followed by a powerful downtrend, wave 3{-2}.
- Under the rules of Elliott wave analysis, wave 2{-2} cannot move beyond the beginning of wave 1{-2}, which was the January 4, 2022 peak at 4953.25
Alternative analysis:
- Wave E{-4} is in its fourth of five subwaves, wave D{-5}, a declining wave that will be followed by an upward push to completion
Reading the chart. The chart contains, in red, the Fibonacci ladder for the retracement of wave C{-3}, the last leg of the upward correction.
Price movements — waves – – in Elliott wave analysis are labeled with numbers within trending waves and letters with corrective waves. The subscripts — numbers in curly brackets — designate the wave’s degree, which, in Elliott wave analysis, means the relative position of a wave within the larger and smaller structures that make up the chart. R.N. Elliott, who in the 1930s developed the form of analysis that bears his name, viewed the chart as a complex structure of smaller waves nested within larger waves, which in turn are nested within still larger waves. In mathematics it’s called a fractal structure, where at every scale the pattern is similar to the others.
We Are Here. These are the waves currently in progress under my principal analysis. Each line on the list shows the wave number, with the subscript in curly brackets, the traditional degree name, the starting date, the starting price of the S&P 500 E-mini futures, and the direction of the wave.
- S&P 500 Index:
- 5{+3} Supercycle, 7/8/1932, 4.40 (up)
- 5{+2} Cycle, 12/9/1974, 60.96 (up)
- 5{+1} Primary, 3/6/2009, 666.79 (up)
- 5{0} Intermediate, 12/26/2018, 2346.58 (up)
- S&P 500 Futures and index:
- 4{-1} Minor, 1/4/2022, 4953.25 (down) (futures), 4818.62 (down) (index)
- S&P 500 Futures:
- 2{-2} Minute, 10/13/2022, 3577.75 (up)
Learning and other resources. Elliott wave analysis provides context, not prophecy. As the 20th century semanticist Alfred Korzybski put it in his book Science and Sanity (1933), “The map is not the territory … The only usefulness of a map depends on similarity of structure between the empirical world and the map.” And I would add, in the ever-changing markets, we can judge that similarity of structure only after the fact.
See the menu page Analytical Methods for a rundown on where to go for information on Elliott wave analysis.
By Tim Bovee, Portland, Oregon, July 19, 2023
Disclaimer
Tim Bovee, Private Trader tracks the analysis and trades of a private trader for his own accounts. Nothing in this blog constitutes a recommendation to buy or sell stocks, options or any other financial instrument. The only purpose of this blog is to provide education and entertainment.
No trader is ever 100 percent successful in his or her trades. Trading in the stock and option markets is risky and uncertain. Each trader must make trading decisions for his or her own account, and take responsibility for the consequences.
License
All content on Tim Bovee, Private Trader by Timothy K. Bovee is licensed under a Creative Commons Attribution-ShareAlike 4.0 International License.
Based on a work at www.timbovee.com.

You must be logged in to post a comment.