3:30 p.m. New York time
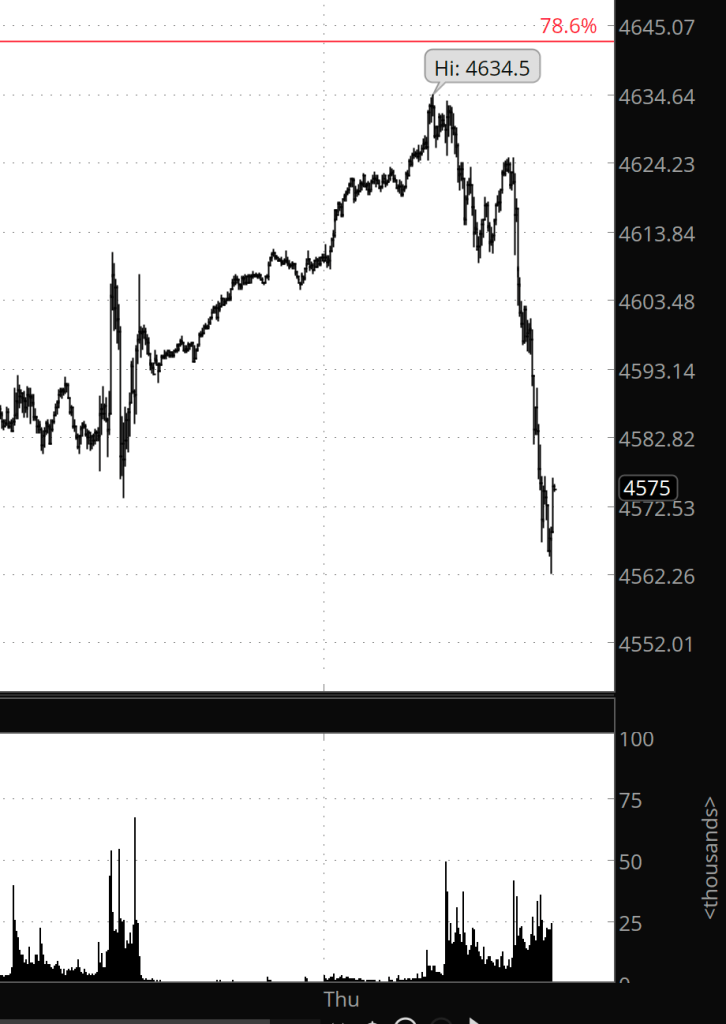
Half an hour before the closing bell. The S&P 500 futures have declined throughout the session so far, reaching back into the 4560s. The price never exceeded the overnight high, 4634.50.
Two interpretations:
- Either the second corrective pattern within the long-running upward compound correction ended at the overnight peak, perhaps ending the correction …
- … Or the alternative scenario is playing out; wave C{-5} ended at the overnight peak, and the subsequent decline is wave D{-5} as the second corrective pattern continues.
At this point, there’s insufficient evidence to choose between those interpretations.
I’ve updated this morning’s chart.
9:35 a.m. New York time
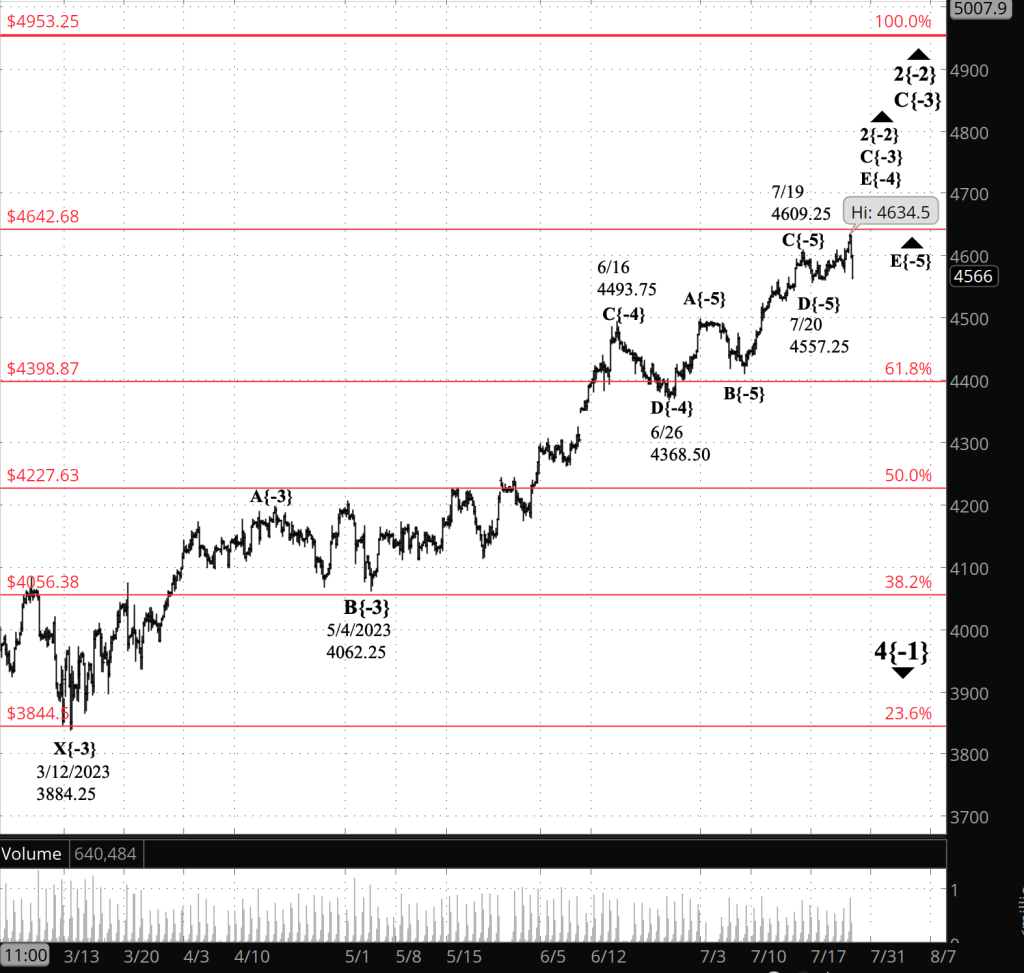
What’s happening now? The S&P 500 E-mini futures rose overnight, reaching beyond the the July 19 high, 4009.25, into the 4630s. The new upward correction high is only 7 points below the 78.6% Fibonacci retracement level, a common reversal point. The Fibonacci ladder is shown on the chart in red.
What does it mean? The upward corrective pattern that began on March 12 has moved one step closer to completion. The corrective pattern is the second within an upward correction that began last October.
The complexity of the fractal structure require reference to the wave labels on the chart. See the “Reading the Chart” section just before the chart for an explanation of the labeling system.
The subwave driving the correction is two degrees smaller than the correction degree. That subwave, labeled E{-4} on the chart, is now in its fifth and final subwave, labeled E{-5}.
When wave E{-5} is complete, it will cascade up the fractal structure, marking the end of waves E{-4} and C{-3}.
Will it also mean the end of the correction itself? Well, that depends. The correction has taken a compound form and is in its second corrective patterns. Compound corrections can contain two or three corrective patterns.
If the present correction, wave 2{-2}, continues into a third such pattern, then it will likely continue for some time. The second corrective pattern has already lasted 4-1/2 months, and it would be reasonable to expect a similar length from a third corrective pattern, a lengthy delay before the future downtrend, wave 3{-2}, begins.
If wave 2{-2} ends with the second corrective pattern, then the powerful downtrend, wave 3{-2}, will begin immediately. In either case, I expect wave 3{-2} to move below the start of the upward correction, 3502, and almost certainly significantly below that level.
What are the alternatives? The falling fourth wave within wave C{-4}, labeled wave D{-5}, was quite shallow. It’s possible to interpret it as a subwave of wave C{-5}, the third subwave within wave C{-4}, with two more subwaves, D{-5} and E{-5}, to come before the second corrective pattern is complete.
Reading the chart. Price movements — waves – – in Elliott wave analysis are labeled with numbers within trending waves and letters with corrective waves. The subscripts — numbers in curly brackets — designate the wave’s degree, which, in Elliott wave analysis, means the relative position of a wave within the larger and smaller structures that make up the chart. R.N. Elliott, who in the 1930s developed the form of analysis that bears his name, viewed the chart as a complex structure of smaller waves nested within larger waves, which in turn are nested within still larger waves. In mathematics it’s called a fractal structure, where at every scale the pattern is similar to the others.
[S&P 500 E-mini futures at 3:30 p.m., 260-minute bars, with volume]
What does Elliott wave theory say? Here are the waves that underlie the analysis.
Principal analysis:
- An upward correction, a Zigzag, wave 2{-2}, began on October 13, 2022 and is underway.
- The upward correction, wave 2{-2}, is taking a compound form, which can contain up to three corrective patterns.
- The correction is in its second corrective pattern, which is in wave C{-3}, its final wave.
- The end of the present wave C{-3} could also be the end of the wave 2{-2} correction if the compound structure contains two subwaves.
- Or the present corrective pattern could be followed by a declining connector, wave X{-3}, and then a third corrective pattern.
- Wave C{-3} will have five subwaves and is at wave E{-4}, the final subwave.
- Wave E{-4} is in its final of five subwaves, wave E{-5}.
- Wave 2{-2}, when complete, will be followed by a powerful downtrend, wave 3{-2}.
- Under the rules of Elliott wave analysis, wave 2{-2} cannot move beyond the beginning of wave 1{-2}, which was the January 4, 2022 peak at 4953.25
Alternative analysis:
- Wave E{-4} is in its third of five subwaves, wave C{-5}, a rising wave that will be followed by an downward movement and then a final rise to completion.
We Are Here.
These are the waves currently in progress under my principal analysis. Each line on the list shows the wave number, with the subscript in curly brackets, the traditional degree name, the starting date, the starting price of the S&P 500 E-mini futures, and the direction of the wave.
- S&P 500 Index:
- 5{+3} Supercycle, 7/8/1932, 4.40 (up)
- 5{+2} Cycle, 12/9/1974, 60.96 (up)
- 5{+1} Primary, 3/6/2009, 666.79 (up)
- 5{0} Intermediate, 12/26/2018, 2346.58 (up)
- S&P 500 Futures and index:
- 4{-1} Minor, 1/4/2022, 4953.25 (down) (futures), 4818.62 (down) (index)
- S&P 500 Futures:
- 2{-2} Minute, 10/13/2022, 3502 (up)
Learning and other resources. Elliott wave analysis provides context, not prophecy. As the 20th century semanticist Alfred Korzybski put it in his book Science and Sanity (1933), “The map is not the territory … The only usefulness of a map depends on similarity of structure between the empirical world and the map.” And I would add, in the ever-changing markets, we can judge that similarity of structure only after the fact.
See the menu page Analytical Methods for a rundown on where to go for information on Elliott wave analysis.
By Tim Bovee, Portland, Oregon, July 27, 2023
Disclaimer
Tim Bovee, Private Trader tracks the analysis and trades of a private trader for his own accounts. Nothing in this blog constitutes a recommendation to buy or sell stocks, options or any other financial instrument. The only purpose of this blog is to provide education and entertainment.
No trader is ever 100 percent successful in his or her trades. Trading in the stock and option markets is risky and uncertain. Each trader must make trading decisions for his or her own account, and take responsibility for the consequences.
License
All content on Tim Bovee, Private Trader by Timothy K. Bovee is licensed under a Creative Commons Attribution-ShareAlike 4.0 International License.
Based on a work at www.timbovee.com.

You must be logged in to post a comment.