3:30 p.m. New York time
Half an hour before the closing bell. The S&P 500 futures rose early in the session to almost 4620 and the fell to just below 4600. The net movement has been sideways.
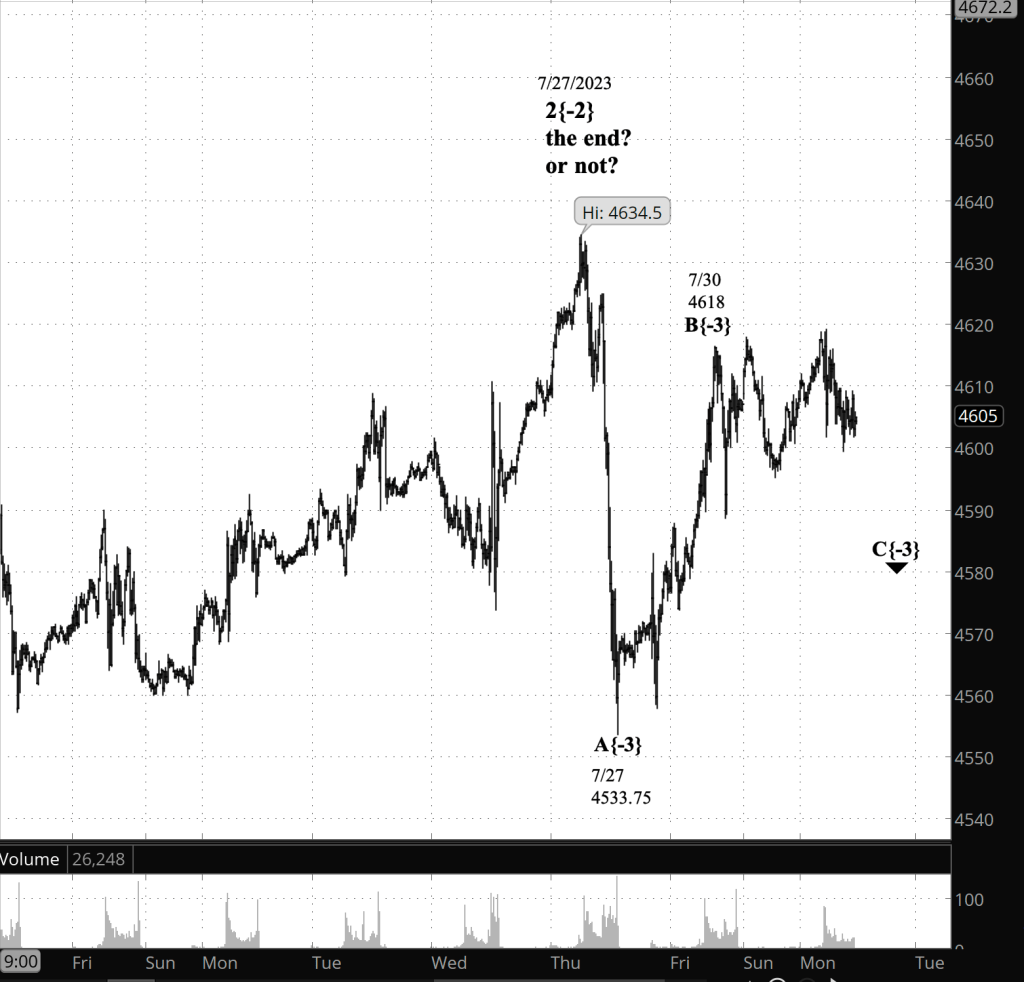
As the pattern has played out, it’s Elliott wave form has gained some clarity, and I’ve redone to analysis to conform. In relation to the peak on July 27, which may or may not have ended the long-running upward correction, wave 2{-2}, that began on October 13, 2022…
- The decline from the peak has taken the form of a corrective pattern.
- The first wave down, wave A{-6} on the chart, has three subwaves of a similar magnitude to meet the Elliott rule of proportionality. This is consistent with a connecting wave within a compound correction.
- The rising second part, wave B{-6}, also have three subwaves, but with greater ambiguity.
- The present sideways/declining movement, wave C{-6}, has yet to produce a clear subwave pattern.
Wave 2{-2} has taken the form of a compound correction, which means it can contain two or three corrective patterns. The July 27 peak was the end of the second corrective pattern. In question is whether there will be a third.
A connector wave, called an X-wave in earlier forms of Elliott wave analysis, has three subwaves, and that is what has played out so far on the chart. With the first subwave containing three still smaller subwaves, the decline is taking the form of a Flat (subwave counts = 3, 3, 5 for the three waves within it).
If it proves to be an X-wave, then it will be followed by third corrective pattern.
Proportionality is a bit of a problem. The final subwave, wave (C{-3}, of the final wave of the second corrective pattern, ran from March to July. This “X-wave” pattern, if that’s what it is, has reached its third subwave in two trading sessions. There’s no rule that would rule it out, but still…
I’ve udpated the chart.
9:35 a.m. New York time
What’s happening now? The S&P 500 E-mini futures fluctuated from the 4590s into the 4610s overnight, remaining below last week’s high, 4634.50.
What does it mean? Friday’s analysis gave an inventory of ambiguities on the chart. Those ambiguities will be resolved by what happens after the July 27 peak, and I’ve moved in the chart in closer to have a detailed view.
At this point the degrees — where the waves stand within the fractal hierarchy — are purely arbitrary. This early in the game, I haven’t the foggiest idea.
From the peak, the price declined in three waves down to 4553.75. It then rose to 4618 after trading resumed overnight, declined, and then rose again, remaining below the overnight high.
On the chart below, I counted three waves in the July 27 decline, with the 3rd wave being the longest, a classic trending pattern.
The rise that followed is less clear, although it can be counted as the first wave in a correction, an A wave, with five subwaves. This is what a Zigzag correction looks like. By this analysis, the correction is now in its second of three waves, the B wave.
The evidence so far is consistent with the upward correction that began on October 13, 2022 having ended on July 27, last Thursday.
What are the alternatives? However, there are other interpretations that might fit. There is no clear conclusion yet.
[S&P 500 E-mini futures at 3:30 p.m., 5-minute bars, with volume]
What does Elliott wave theory say? I’m still working this out. Tomorrow, maybe.
We Are Here.
These are the waves currently in progress under my principal analysis. Each line on the list shows the wave number, with the subscript in curly brackets, the traditional degree name, the starting date, the starting price of the S&P 500 E-mini futures, and the direction of the wave.
- S&P 500 Index:
- 5{+3} Supercycle, 7/8/1932, 4.40 (up)
- 5{+2} Cycle, 12/9/1974, 60.96 (up)
- 5{+1} Primary, 3/6/2009, 666.79 (up)
- 5{0} Intermediate, 12/26/2018, 2346.58 (up)
- S&P 500 Futures and index:
- 4{-1} Minor, 1/4/2022, 4953.25 (down) (futures), 4818.62 (down) (index)
- S&P 500 Futures:
- 3{-2} Minute, 7/27/2023, 3502 (down) (tenatively)
Reading the chart. Price movements — waves – – in Elliott wave analysis are labeled with numbers within trending waves and letters with corrective waves. The subscripts — numbers in curly brackets — designate the wave’s degree, which, in Elliott wave analysis, means the relative position of a wave within the larger and smaller structures that make up the chart. R.N. Elliott, who in the 1930s developed the form of analysis that bears his name, viewed the chart as a complex structure of smaller waves nested within larger waves, which in turn are nested within still larger waves. In mathematics it’s called a fractal structure, where at every scale the pattern is similar to the others.
Learning and other resources. Elliott wave analysis provides context, not prophecy. As the 20th century semanticist Alfred Korzybski put it in his book Science and Sanity (1933), “The map is not the territory … The only usefulness of a map depends on similarity of structure between the empirical world and the map.” And I would add, in the ever-changing markets, we can judge that similarity of structure only after the fact.
See the menu page Analytical Methods for a rundown on where to go for information on Elliott wave analysis.
By Tim Bovee, Portland, Oregon, July 31, 2023
Disclaimer
Tim Bovee, Private Trader tracks the analysis and trades of a private trader for his own accounts. Nothing in this blog constitutes a recommendation to buy or sell stocks, options or any other financial instrument. The only purpose of this blog is to provide education and entertainment.
No trader is ever 100 percent successful in his or her trades. Trading in the stock and option markets is risky and uncertain. Each trader must make trading decisions for his or her own account, and take responsibility for the consequences.
License
All content on Tim Bovee, Private Trader by Timothy K. Bovee is licensed under a Creative Commons Attribution-ShareAlike 4.0 International License.
Based on a work at www.timbovee.com.

You must be logged in to post a comment.