3:30 p.m. New York time
Half an hour before the closing bell. The S&P 500 futures traced a downward movement during the session, from the session high, 4541.25, to a low of 4515, that resembles the first three waves of a five-wave trend. It was followed by an upward movement that fits the pattern of a 4th-wave upward correction.
While both extremes are close to the 61.8% Fibonacci retracement level, the five-wave pattern is a trend and, perhaps, a sign that the price is breaking free from that level and starting the next leg of its journey.
What it means is still up in the air. The trend is of a small degree, taking only a few hours to reach completion. It could be a subwave within the final wave of the upward correction, it could be the start of a connecting wave that will lead to a second corrective pattern within the correction, or the correction may have ended at the peak, 4541.25, and the five waves may be the tentative first steps in what will be a powerful downtrend.
Time will answer the questions. We’re not there yet.
Here is a chart of the futures today showing the waves.
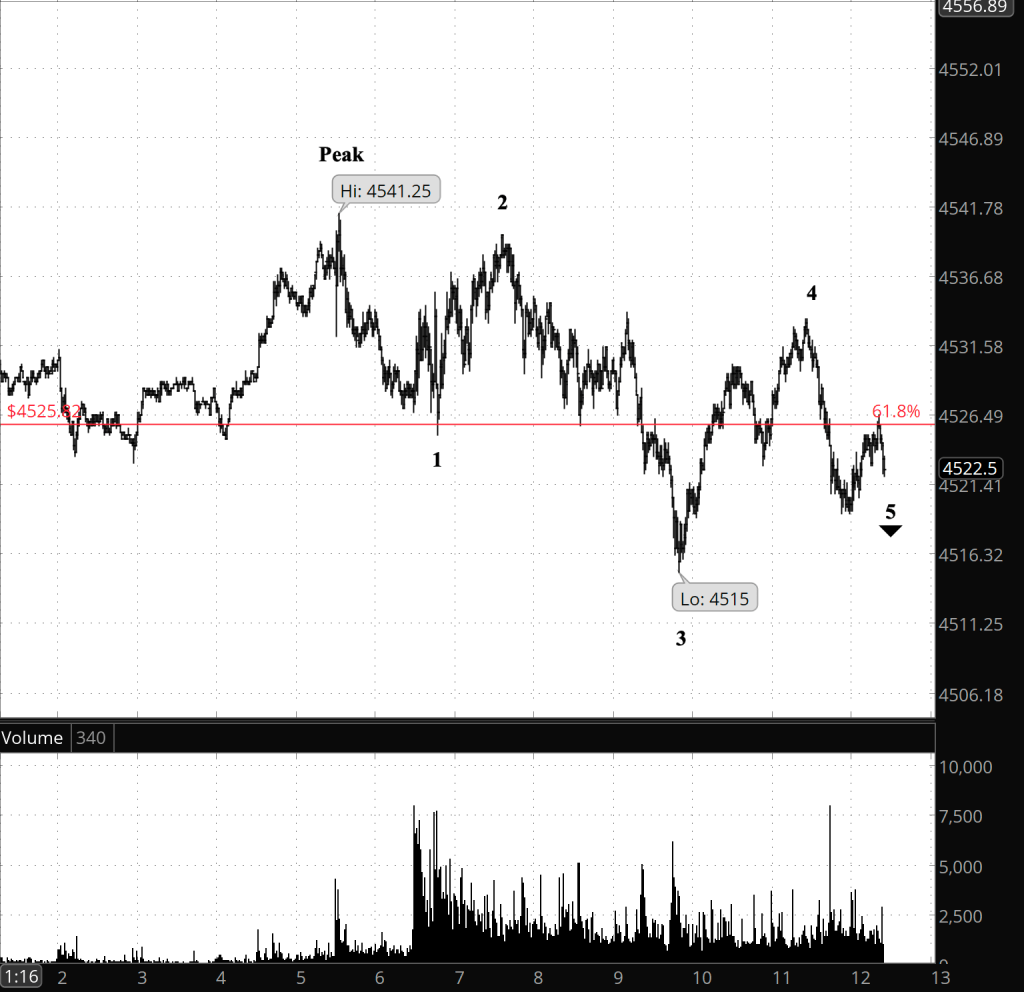
[S&P 500 E-mini futures at 3:25 p.m., 1-minute bars, with volume]
9:35 a.m. New York time
What’s happening now? Overnight, the S&P 500 E-mini futures stayed close to the 61.8% Fibonacci retracement level (in red on the chart), remaining in the 4520s and 45430s, then rose to an overnight 4541.25 peak as an inflation indicator, Personal Income and Outlays, was released, from which it quickly reteated.
What does it mean? The overnight movement left unresolved the two open questions about the chart: First, is the upward corrective pattern that began on August 18 still underway, or has it reached its end? And second, if the corrective pattern has ended, then has the overall correction, a 2nd wave, also ended, or will it be a compound correction, containing two or three corrective patterns?
For the chart, I’ve chosen labels consistent with the upward correction wave 2{-3}, still being underway. But all of the possibilities are of equal likelihood at this point.
What are the alternatives? None at present, beyond the two questions listed above.
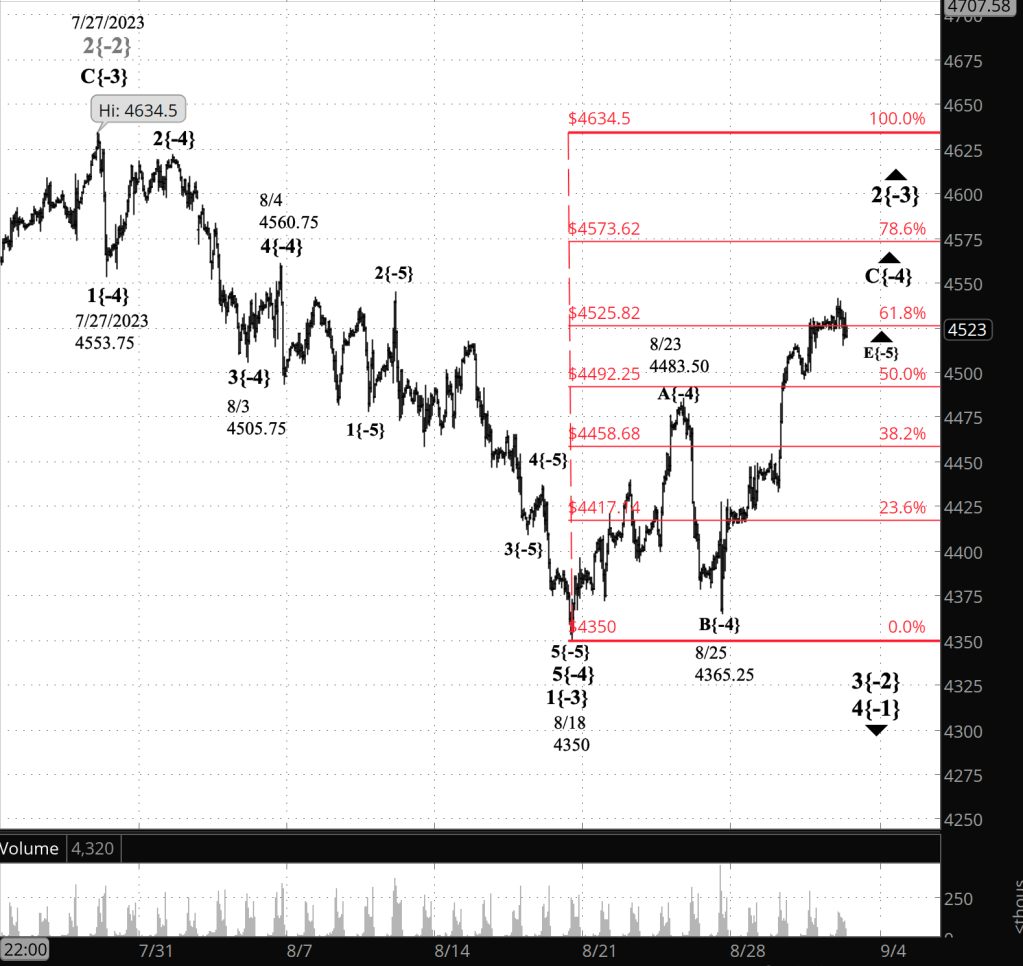
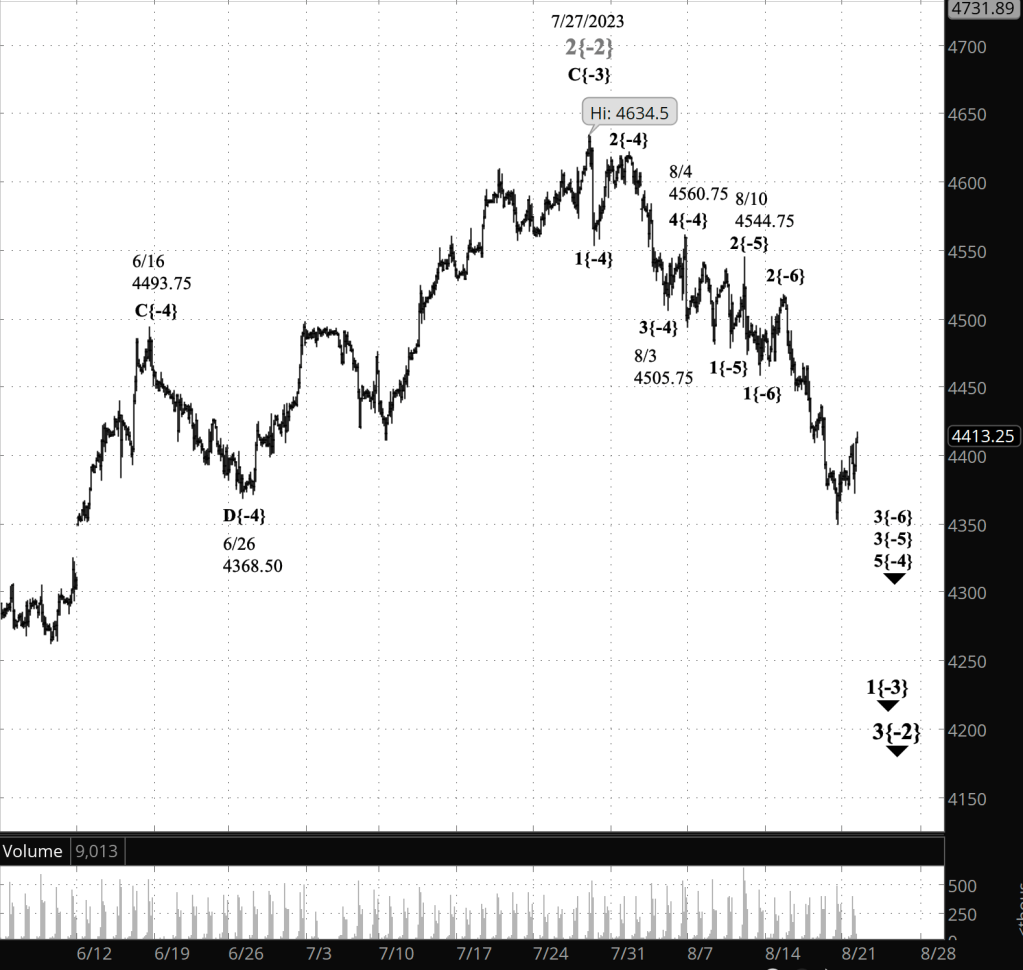
[S&P 500 E-mini futures at 9:35 a.m., hourly bars, with volume]
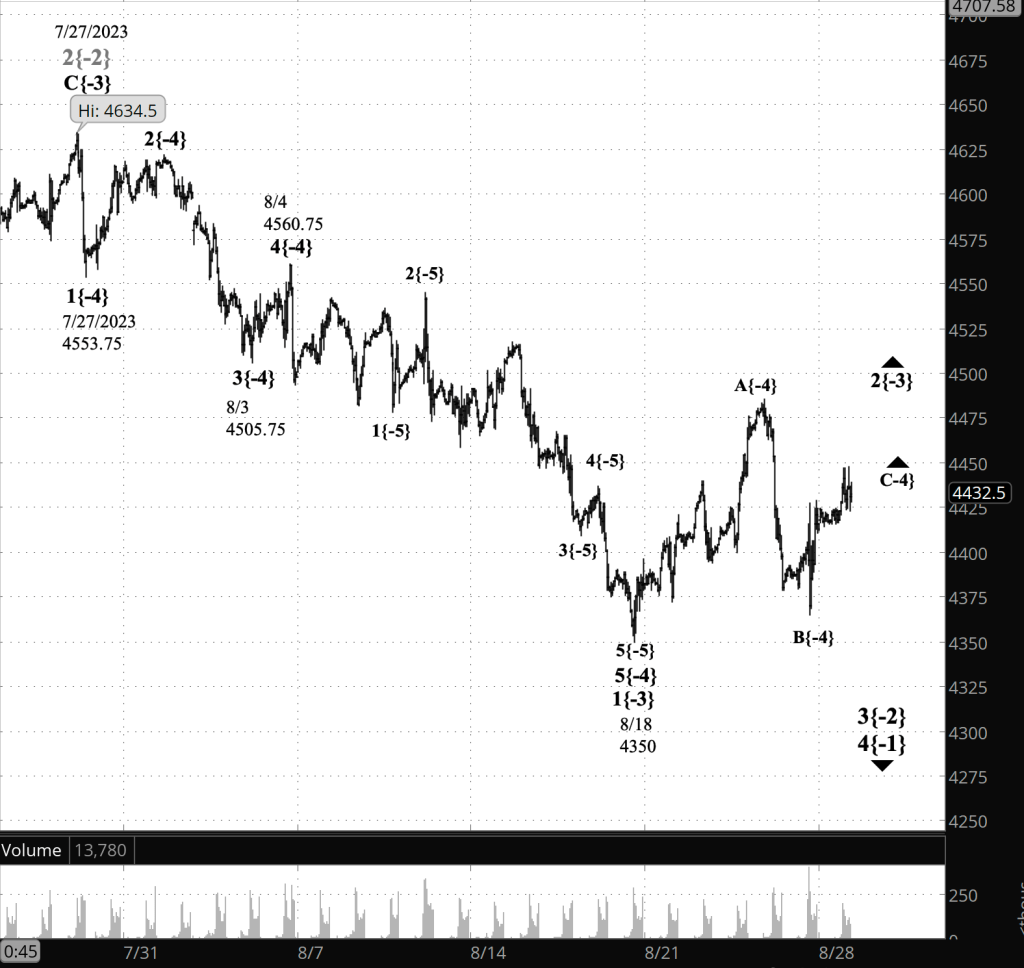
What does Elliott wave theory say? Here are the waves that underly the analyses.
Principal analysis:
- A downtrend wave 3{-2}, began on July 27 is underway.
- Internally, wave 3{-2} complete its first subwave, wave 1{-3}, on August 18, and wave 2{-3}, an upward correction, began..
- Within wave 2{-3}, rising wave C{-4} is underway.
- Within rising wave C{-4}, rising wave E{-5} is underway.
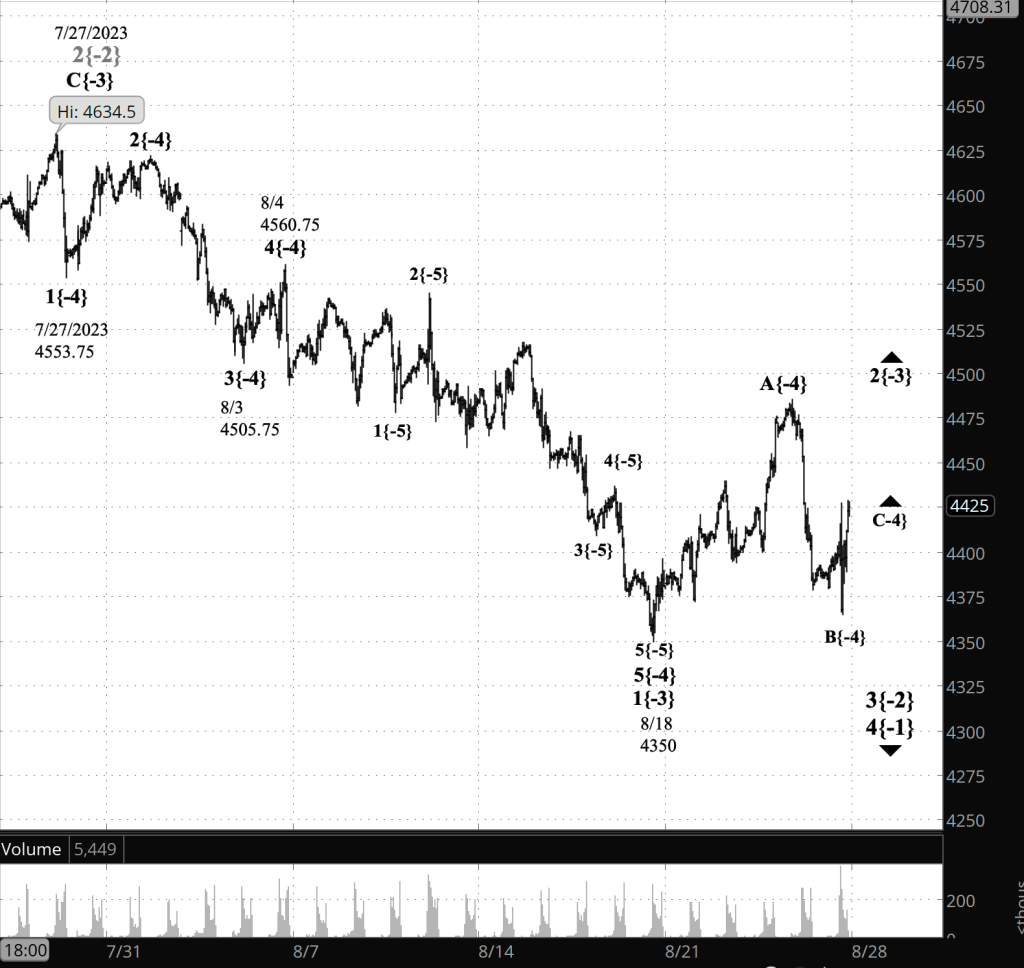
Big picture:
- Both the wave 2{-2} correction and wave 3{-2} downtrend are subwaves of wave 4{-1}, a downtrend that began on January 4, 2022.
- Wave 4{-1}, in turn, is a subwave of wave 5{0}, an expanding Diagonal Triangle that began on December 26, 2018.
- Wave 4{-1} may eventually reach the lower boundary of wave 5{0}, presently slightly below 1800 and declining further each day.
- Wave 4{-1} will be followed by rising wave 5{-1}, the final wave in the Triangle.
We Are Here.
These are the waves currently in progress under my principal analysis. Each line on the list shows the wave number, with the subscript in curly brackets, the traditional degree name, the starting date, the starting price of the S&P 500 E-mini futures, and the direction of the wave.
- S&P 500 Index:
- 5{+3} Supercycle, 7/8/1932, 4.40 (up)
- 5{+2} Cycle, 12/9/1974, 60.96 (up)
- 5{+1} Primary, 3/6/2009, 666.79 (up)
- 5{0} Intermediate, 12/26/2018, 2346.58 (up)
- S&P 500 Futures and index:
- 4{-1} Minor, 1/4/2022, 4953.25 (down) (futures), 4818.62 (down) (index)
- S&P 500 Futures:
- 3{-2} Minute, 7/27/2023, 3502 (down)
Reading the chart. Price movements — waves – – in Elliott wave analysis are labeled with numbers within trending waves and letters with corrective waves. The subscripts — numbers in curly brackets — designate the wave’s degree, which, in Elliott wave analysis, means the relative position of a wave within the larger and smaller structures that make up the chart. R.N. Elliott, who in the 1930s developed the form of analysis that bears his name, viewed the chart as a complex structure of smaller waves nested within larger waves, which in turn are nested within still larger waves. In mathematics it’s called a fractal structure, where at every scale the pattern is similar to the others.
Learning and other resources. Elliott wave analysis provides context, not prophecy. As the 20th century semanticist Alfred Korzybski put it in his book Science and Sanity (1933), “The map is not the territory … The only usefulness of a map depends on similarity of structure between the empirical world and the map.” And I would add, in the ever-changing markets, we can judge that similarity of structure only after the fact.
See the menu page Analytical Methods for a rundown on where to go for information on Elliott wave analysis.
By Tim Bovee, Portland, Oregon, August 31, 2023
Disclaimer
Tim Bovee, Private Trader tracks the analysis and trades of a private trader for his own accounts. Nothing in this blog constitutes a recommendation to buy or sell stocks, options or any other financial instrument. The only purpose of this blog is to provide education and entertainment.
No trader is ever 100 percent successful in his or her trades. Trading in the stock and option markets is risky and uncertain. Each trader must make trading decisions for his or her own account, and take responsibility for the consequences.
License
All content on Tim Bovee, Private Trader by Timothy K. Bovee is licensed under a Creative Commons Attribution-ShareAlike 4.0 International License.
Based on a work at www.timbovee.com.


You must be logged in to post a comment.