3:30 p.m. New York time
Half an hour before the closing bell. The S&P 500 futures fell during the session, reaching into the 4530s. No change in this morning’s analysis. I’ve updated the upper chart.
9:35 a.m. New York time
What’s happening now? The S&P 500 E-mini futures fell from the 4590s into the 4550s overnight, rising back into the 4580s as the opening bell drew nearer.
What does it mean? The decline since last week so far has done nothing to answer the questions posed by the chart: Has the second corrective pattern within an upward compound correction that began in October reached its end, and if so, has a correction itself also ended, or will there there a third corrective pattern?
Each of the questions will have a major impact on the market’s directionality. As for myself, I’m being very cautious about how I place my bets.
In the upper chart, I’ve pulled back for a broader look at the futures, showing the correction’s final subwave, which began on May 4.
The lower chart shows the entire downtrend that began on January 4, 2022 — the 1st wave that ended on October 13, and the 2nd wave, which may or may not have reached completion. (The blue line is the upper boundary of an expanding Diagonal Triangle that began in December 2018.)
At this point, I don’t have a principal analysis, only alternatives.
What are the alternatives? At issue is the meaning of the decline that began on June 27.
The June 27 peak may or may not be the end of the second corrective pattern within the upward correction, wave 2{-2}. Those are the first two alternatives upon which the analysis depends.
If the peak isn’t the end of the pattern, then the price will quickly reverse and the final way of the pattern, wave C{-3}, will continue its rise. Under the rules that govern 2nd-wave corrections, the price must remain below the start of the preceding 1st wave: 4953.25 on the futures and 4818.62 on the index.
If the peak is the end of the pattern, then there are two more alternatives.
A compound correction can contain two or three corrective patterns. If the second pattern is the final pattern, then the correction will have ended and a powerful downtrend, wave 3{-3}, will begin. If the correction moves on to a third corrective pattern, then the second pattern will be followed by a relatively small downtrending connector wave, X{-3}, and then the first wave of the third pattern, rising wave A{-3}.
Those are the five alternatives. As the charts show, the present decline so far is quite small on the futures chart and almost invisible on the larger index chart. It may be awhile before the ambiguities are resolved.
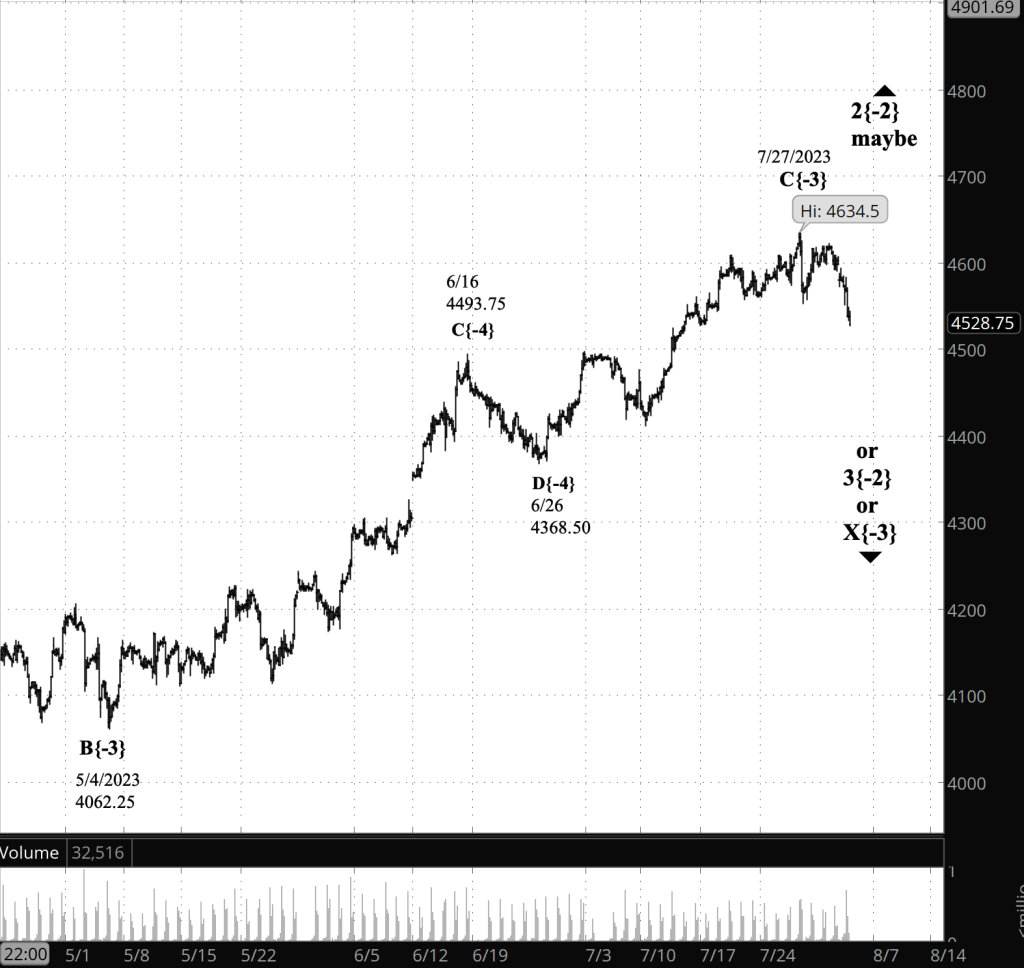
[S&P 500 E-mini futures at 3:30 p.m., 165-minute bars, with volume]

[S&P 500 index at 9:30 a.m., daily bars]
What does Elliott wave theory say? Here are the waves that underly the analysis.
Known facts:
- An upward correction, a Zigzag, wave 2{-2}, began on October 13, 2022 and is underway.
- The upward correction, wave 2{-2}, is taking a compound form, which can contain up to three corrective patterns.
- The correction has completed its second corrective pattern.
Ambiguities
- Is the July 27 peak the end of wave C{-3} within the correction, wave 2{-2}?
- If wave C{-3} has ended, has wave 2{-2} also ended or will it produce a connector, wave X{-3}, and then move on to wave A{-3}, the first wave of a third corrective pattern?
- If wave 2{-2} has ended, a powerful downtrend, wave 3{-3}, is taking its tentative 1st steps.
We Are Here.
These are the waves currently in progress under my principal analysis. Each line on the list shows the wave number, with the subscript in curly brackets, the traditional degree name, the starting date, the starting price of the S&P 500 E-mini futures, and the direction of the wave.
- S&P 500 Index:
- 5{+3} Supercycle, 7/8/1932, 4.40 (up)
- 5{+2} Cycle, 12/9/1974, 60.96 (up)
- 5{+1} Primary, 3/6/2009, 666.79 (up)
- 5{0} Intermediate, 12/26/2018, 2346.58 (up)
- S&P 500 Futures and index:
- 4{-1} Minor, 1/4/2022, 4953.25 (down) (futures), 4818.62 (down) (index)
- S&P 500 Futures:
- Maybe 2{-2} Minute, 10/13/2022, 3502 (up) …
- … or 3{-2} Minute, 7/27/2023, 4634.50 (down)
Reading the chart. Price movements — waves – – in Elliott wave analysis are labeled with numbers within trending waves and letters with corrective waves. The subscripts — numbers in curly brackets — designate the wave’s degree, which, in Elliott wave analysis, means the relative position of a wave within the larger and smaller structures that make up the chart. R.N. Elliott, who in the 1930s developed the form of analysis that bears his name, viewed the chart as a complex structure of smaller waves nested within larger waves, which in turn are nested within still larger waves. In mathematics it’s called a fractal structure, where at every scale the pattern is similar to the others.
Learning and other resources. Elliott wave analysis provides context, not prophecy. As the 20th century semanticist Alfred Korzybski put it in his book Science and Sanity (1933), “The map is not the territory … The only usefulness of a map depends on similarity of structure between the empirical world and the map.” And I would add, in the ever-changing markets, we can judge that similarity of structure only after the fact.
See the menu page Analytical Methods for a rundown on where to go for information on Elliott wave analysis.
By Tim Bovee, Portland, Oregon, August 2, 2023
Disclaimer
Tim Bovee, Private Trader tracks the analysis and trades of a private trader for his own accounts. Nothing in this blog constitutes a recommendation to buy or sell stocks, options or any other financial instrument. The only purpose of this blog is to provide education and entertainment.
No trader is ever 100 percent successful in his or her trades. Trading in the stock and option markets is risky and uncertain. Each trader must make trading decisions for his or her own account, and take responsibility for the consequences.
License
All content on Tim Bovee, Private Trader by Timothy K. Bovee is licensed under a Creative Commons Attribution-ShareAlike 4.0 International License.
Based on a work at www.timbovee.com.

You must be logged in to post a comment.