3:30 p.m. New York time
Half an hour before the closing bell. The S&P 500 futures fell into the 4420s after the Federal Open Market Commitee released the minutes of the July 25-26 meeting.
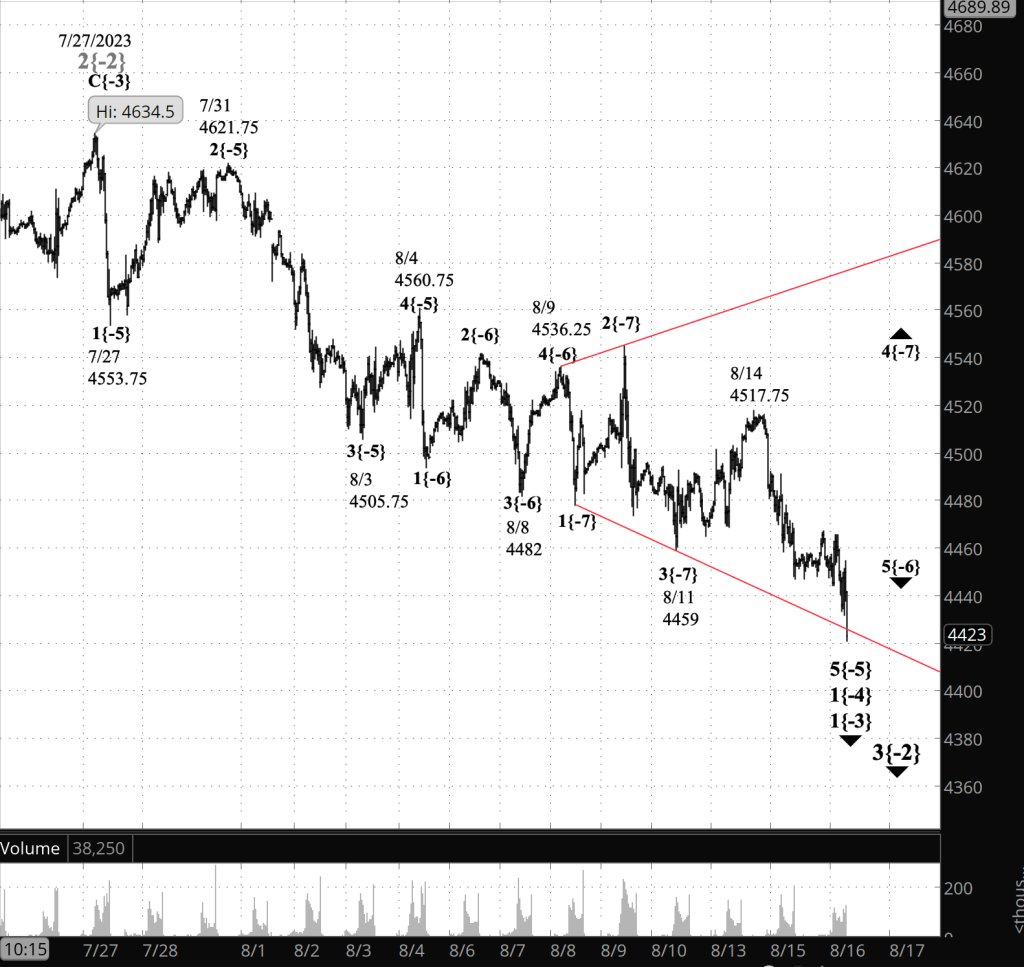
As is the practice when dealing with both price channels and triangles, I’ve redrawn the lower boundary to account for repositioning a few days back of the end of wave 3{-7} to the August 11 low. That adjustment brings most of what has happened since within the boundaries of the expanding Diagonal Triangle that began on August 9.
That needful repositioning lends credence to the this morning’s Principal Analysis, which sees the next to the last subwave of the triangle, wave 4{-7}, as still being underway. When it is complete, the final subwave, wave 5{-7}, will carry the price back to the upper boundary, which is presently in the 4570s and is rising every minute — that’s the “expanding” part of an expanding Diagonal Triangle.
Wave 5{-7} will end the triangle, which is wave 5{-6}, and will aso end the parent wave, 5{-5}, and the grandparent wave, 1{-4}.
An upward correction, wave 2{-4}, will follow. Under the rules discovered by R.N. Elliott, the developer of Elliott wave analysis, a 2nd wave must remain below the start of the preceding 1st wave of the same degree, which began on July 27 from 4634.50
9:35 a.m. New York time
What’s happening now? The S&P 500 E-mini futures tracked sideways overnight, remaining in the 4440s and 4450s, slightly below the lower boundary of the expanded Diagonal Triangle that began on August 9. Only once did it break from that range, rising to 4467.25, and then retreating.
What does it mean? The overnight pattern does nothing to resolve the ambiguities in the chart. The triangle will have five subwaves. Which subwave is in progress: The 4th, or a much-truncated 5th?
The normal form taken by a triangle is for the waves to bounce off of the price-channel boundaries. The 4th subwave so far has only gotten about halfway to the upper channel. So I’ve chosen a conservative analysis, marking the chart to show that the 4th subwave is underway.
Sometimes waves are truncated — they fall short of the boundary by a considerable amount. If that’s the case here, then the rising 4th wave ended at the August 14 high, 4517.25, and the declining 5th wave began.
[S&P 500 E-mini futures at 9:35 a.m., 35-minute bars, with volume]
What are the alternatives? There are three:
Alternative #1: Final wave scenario
I discussed Alternative #1 above. Here I add the Elliott wave numbers.
- Rising wave 4{-7}, a subwave of wave 5{-6}, an expanding Diagonal Triangle, ended August 14, at 4517.75. Declining wave 5{-7}, the final subwave of the triangle, began from that point.
Alternative #2: Connector wave scenario
The long-running upward correction, wave 2{-2}, that has dominated the chart since last autumn may still be underway. Wave 2{-2} ran from 3502 to 4634.50. The low so far in the subsequent decline is 4459. That means that the decline has retraced only 15.5% of the upward correction, meaning that the scenario seeing the present decline as connecting two corrective patterns within an ongoing upward correction remains plausible.
- Wave 2{-2}, an upward compound correction that began on October 13, 2022 completed a second corrective pattern on July 27.
- The subsequent decline is wave X{-3}, a downward connector between the second corrective pattern and the future third corrective pattern.
- Once the third corrective pattern within wave 2{-2} has ended, a powerful downtrend, wave 3{-2}, will follow.
Alternative #3: Choosing degree
- I have listed the Triangle as being the from of wave 5{-6}. It’s still early days in the decline from July 27, and that wave’s degree could be higher — wave 5{-5} or wave 5{-4}.
What does Elliott wave theory say? Here are the waves that underly the analyses.
Principal analysis:
- A downward correction, wave 3{-2}, began on July and is underway.
- Internally, the correction is in its first subwave, wave 1{-3}.
Alternative analysis #1:
- Rising wave 4{-7}, a subwave of wave 5{-6}, an expanding Diagonal Triangle, ended August 14, at 4517.75. Declining wave 5{-7}, the final subwave of the triangle, began from that point.
Alternative analysis #2:
- Wave 2{-2}, and upward compound correction that began on October 13, 2022 completed a second corrective pattern on July 27.
- The subsequent decline is wave X{-3}, a downward connector between the second corrective pattern and the future third corrective pattern.
- Once the third corrective pattern within wave 2{-2} has ended, a powerful downtrend, wave 3{-2}, will follow
Alternative analysis #3:
- Within wave 1{-3}, things become a bit more ambiguous, since the precise degree of the subwaves won’t become clear until the downtrend has progressed further.
- I’ve chosen, as a guess, to label the subwave of wave 1{-3} as being in its first wave, 1{-4}, which in turn is in its final subwave, wave 5{-5}.
- The final subwave within wave 5{-5} began overnight. Declining wave 5{-6} is now underway.
- Wave 5{-6} is its 2nd of five subwaves, an upward correction designated wave 2{-7}.
Big picture:
- Both the wave 2{-2} correction and wave 3{-2} downtrend are subwaves of wave 4{-1}, a downtrend that began on January 4, 2022.
- Wave 4{-1}, in turn, is a subwave of wave 5{0}, an expanding Diagonal Triangle that began on December 26, 2018.
- Wave 4{-1} may eventually reach the lower boundary of wave 5{0}, presently slightly below 1800 and declining further each day.
- Wave 4{-1} will be followed by rising wave 5{-1}, the final wave in the Triangle.
We Are Here.
These are the waves currently in progress under my principal analysis. Each line on the list shows the wave number, with the subscript in curly brackets, the traditional degree name, the starting date, the starting price of the S&P 500 E-mini futures, and the direction of the wave.
- S&P 500 Index:
- 5{+3} Supercycle, 7/8/1932, 4.40 (up)
- 5{+2} Cycle, 12/9/1974, 60.96 (up)
- 5{+1} Primary, 3/6/2009, 666.79 (up)
- 5{0} Intermediate, 12/26/2018, 2346.58 (up)
- S&P 500 Futures and index:
- 4{-1} Minor, 1/4/2022, 4953.25 (down) (futures), 4818.62 (down) (index)
- S&P 500 Futures:
- 3{-2} Minute, 7/27/2023, 3502 (down)
Reading the chart. Price movements — waves – – in Elliott wave analysis are labeled with numbers within trending waves and letters with corrective waves. The subscripts — numbers in curly brackets — designate the wave’s degree, which, in Elliott wave analysis, means the relative position of a wave within the larger and smaller structures that make up the chart. R.N. Elliott, who in the 1930s developed the form of analysis that bears his name, viewed the chart as a complex structure of smaller waves nested within larger waves, which in turn are nested within still larger waves. In mathematics it’s called a fractal structure, where at every scale the pattern is similar to the others.
Learning and other resources. Elliott wave analysis provides context, not prophecy. As the 20th century semanticist Alfred Korzybski put it in his book Science and Sanity (1933), “The map is not the territory … The only usefulness of a map depends on similarity of structure between the empirical world and the map.” And I would add, in the ever-changing markets, we can judge that similarity of structure only after the fact.
See the menu page Analytical Methods for a rundown on where to go for information on Elliott wave analysis.
By Tim Bovee, Portland, Oregon, August 16, 2023
Disclaimer
Tim Bovee, Private Trader tracks the analysis and trades of a private trader for his own accounts. Nothing in this blog constitutes a recommendation to buy or sell stocks, options or any other financial instrument. The only purpose of this blog is to provide education and entertainment.
No trader is ever 100 percent successful in his or her trades. Trading in the stock and option markets is risky and uncertain. Each trader must make trading decisions for his or her own account, and take responsibility for the consequences.
License
All content on Tim Bovee, Private Trader by Timothy K. Bovee is licensed under a Creative Commons Attribution-ShareAlike 4.0 International License.
Based on a work at www.timbovee.com.

You must be logged in to post a comment.