3:30 p.m. New York time
Half an hour before the closing bell. The S&P 500 futures fell further during the session, reaching into the 4370s. The decline lends credence to this morning’s second analysis, which sees the 5th and final subwave within the expanding Diagonal Triangle as being underway.
I’ve updated the chart.
9:35 a.m. New York time
What’s happening now? The S&P 500 E-mini futures declined overnight to 4409.50 and then rose back into the 4430s.
What does it mean? The low was yet another low within the expanding Diagonal Triangle that began on August 9.
At this point the chart points us toward two analyses of equal likelihood.
The triangle will have five subwaves when complete.
The first analysis, which was the principal analysis in yesterday’s Trader’s Notebook, sees the declining 4th wave of the triangle as being underway. Under this scenario,, the price will eventually rise to the triangle’s upper boundary, and then a declining 5th wave will complete the triangle.
The second analysis, which I’ve switched to today less out of confidence in its correctness and more with a goal of illustrating what it look like, sees the rise that ended on August 14 as being the completion of the 4th wave within the triangle, but in a truncated form. The set-up would have sent it climbing to the upper boundary, but the bullish sentiment simply wasn’t strong enough. The decline that has followed is the 5th and final wave of the triangle.
The triangle is the 5th subwave within a larger downtrend, a 1st wave that began on July 27, and will be followed by a 2nd-wave upward correction.
The ambiguity between the two scenarios won’t be resolved soon. If the price reverses and rises vigorously toward the upper boundary, then the decline from August 9 is over, but is it the 4th wave that’s over or the entire triangle? In other words, is the subsequent rise the 5th subwave within the triangle or the 2nd wave upward correction?
The answer won’t become clear until the price reaches the upper boundary of the triangle. If it moves past it and continues to climb, then the triangle has ended and the upward correction is underway. If it pauses and then declines to the region of the lower boundary, then the 5th subwave of the triangle is continuing.
Sufficiently confusing? I think so, too. Elliott wave analysis in my opinion provides the best context for understanding what the market is doing, but it’s a predictive tool only in the contextual sense: If this then that will happen in the futures.
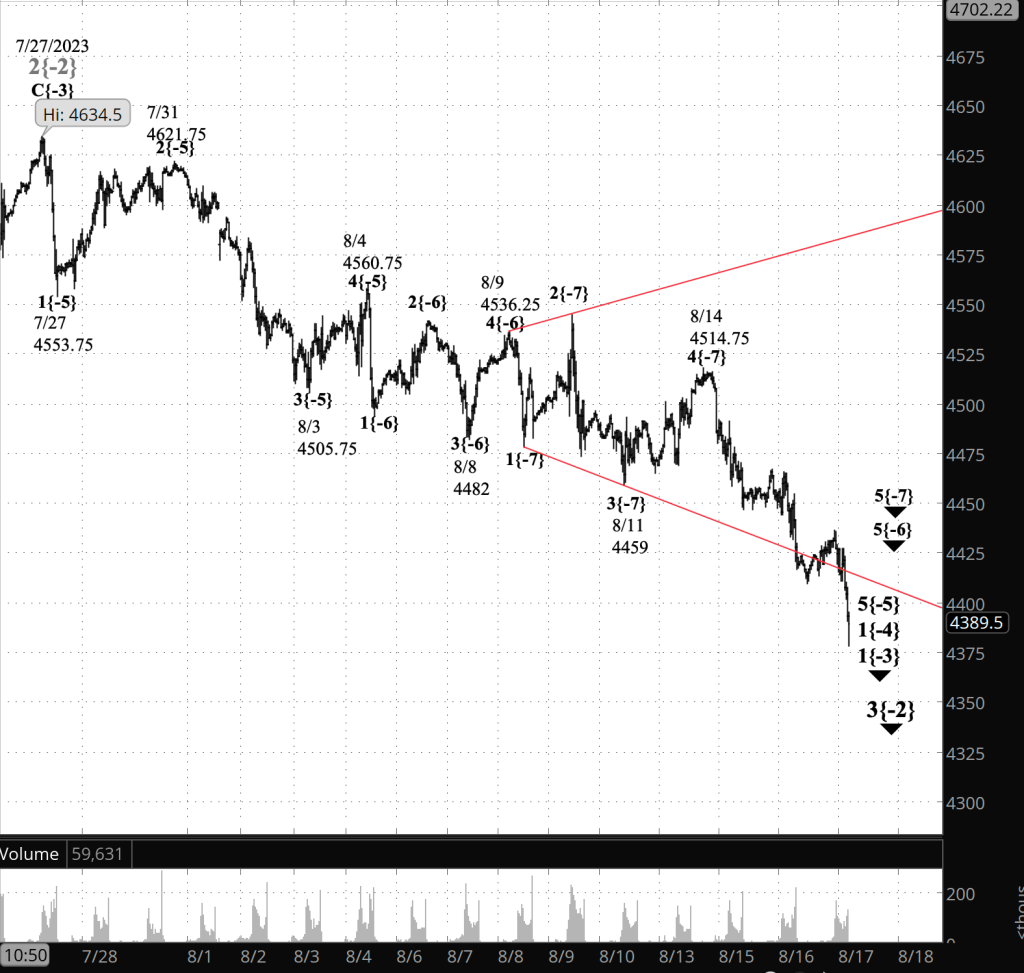
[S&P 500 E-mini futures at 3:30 p.m., 30-minute bars, with volume]
What are the alternatives? In addition to the major ambiguity discussed above, there is another possibility.
Connector wave scenario
The long-running upward correction, wave 2{-2}, that has dominated the chart since last autumn may still be underway. Wave 2{-2} ran from 3502 to 4634.50. The low so far in the subsequent decline is 4459. That means that the decline has retraced only 15.5% of the upward correction, meaning that the scenario seeing the present decline as connecting two corrective patterns within an ongoing upward correction remains plausible.
- Wave 2{-2}, an upward compound correction that began on October 13, 2022 completed a second corrective pattern on July 27.
- The subsequent decline is wave X{-3}, a downward connector between the second corrective pattern and the future third corrective pattern.
- Once the third corrective pattern within wave 2{-2} has ended, a powerful downtrend, wave 3{-2}, will follow.
What does Elliott wave theory say? Here are the waves that underly the analyses.
Both principal analyses:
- A downward correction, wave 3{-2}, began on July and is underway.
- Internally, the correction is in its first subwave, wave 1{-3}.
- Within wave 1{-3}, things become a bit more ambiguous, since the precise degree of the subwaves won’t become clear until the downtrend has progressed further.
- I’ve chosen, as a guess, to label the subwave of wave 1{-3} as being in its first wave, 1{-4}, which in turn is in its final subwave, wave 5{-5}. And within wave 5{-5}, wave 5{-6} is underway.
- Within wave 5{-6},
- either the the truncated next-to-the-last subwave, wave 4{-7}, ended on August 9 and the final subwave, wave 5{-7}, began
- or wave 4{-7} is stilll underway.
Alternative analysis:
- Wave 2{-2}, and upward compound correction that began on October 13, 2022 completed a second corrective pattern on July 27.
- The subsequent decline is wave X{-3}, a downward connector between the second corrective pattern and the future third corrective pattern.
- Once the third corrective pattern within wave 2{-2} has ended, a powerful downtrend, wave 3{-2}, will follow
We Are Here.
These are the waves currently in progress under my principal analysis. Each line on the list shows the wave number, with the subscript in curly brackets, the traditional degree name, the starting date, the starting price of the S&P 500 E-mini futures, and the direction of the wave.
- S&P 500 Index:
- 5{+3} Supercycle, 7/8/1932, 4.40 (up)
- 5{+2} Cycle, 12/9/1974, 60.96 (up)
- 5{+1} Primary, 3/6/2009, 666.79 (up)
- 5{0} Intermediate, 12/26/2018, 2346.58 (up)
- S&P 500 Futures and index:
- 4{-1} Minor, 1/4/2022, 4953.25 (down) (futures), 4818.62 (down) (index)
- S&P 500 Futures:
- 3{-2} Minute, 7/27/2023, 3502 (down)
Reading the chart. Price movements — waves – – in Elliott wave analysis are labeled with numbers within trending waves and letters with corrective waves. The subscripts — numbers in curly brackets — designate the wave’s degree, which, in Elliott wave analysis, means the relative position of a wave within the larger and smaller structures that make up the chart. R.N. Elliott, who in the 1930s developed the form of analysis that bears his name, viewed the chart as a complex structure of smaller waves nested within larger waves, which in turn are nested within still larger waves. In mathematics it’s called a fractal structure, where at every scale the pattern is similar to the others.
Learning and other resources. Elliott wave analysis provides context, not prophecy. As the 20th century semanticist Alfred Korzybski put it in his book Science and Sanity (1933), “The map is not the territory … The only usefulness of a map depends on similarity of structure between the empirical world and the map.” And I would add, in the ever-changing markets, we can judge that similarity of structure only after the fact.
See the menu page Analytical Methods for a rundown on where to go for information on Elliott wave analysis.
By Tim Bovee, Portland, Oregon, August 17, 2023
Disclaimer
Tim Bovee, Private Trader tracks the analysis and trades of a private trader for his own accounts. Nothing in this blog constitutes a recommendation to buy or sell stocks, options or any other financial instrument. The only purpose of this blog is to provide education and entertainment.
No trader is ever 100 percent successful in his or her trades. Trading in the stock and option markets is risky and uncertain. Each trader must make trading decisions for his or her own account, and take responsibility for the consequences.
License
All content on Tim Bovee, Private Trader by Timothy K. Bovee is licensed under a Creative Commons Attribution-ShareAlike 4.0 International License.
Based on a work at www.timbovee.com.

You must be logged in to post a comment.