3:30 p,m, New York time
Half an hour before the closing bell. The S&P 500 futures fell during to the session to 4372.25, breaking past the overnight low by a few points. The price then rose steadily, reaching into the 4410s as the closing bell approached.
The movement is a small subwave upward correction within a downtrending parent wave.
This morning’s analysis remains unchanged. I’ve updated the chart.
2:30 p.m. New York time
BSX iron condor trade. I have entered an iron condor options position on BSX, based on the expected range within which the stock price will fall at expiration, based on options pricing, modified based on Elliott wave analysis. I’ve posted an analysis of the trade.
9:35 a.m. New York time
What’s happening now? The S&P 500 E-mini futures rose slightly after trading resumed overnight, from 4375.75 to 4407.50.
What does it mean? The middle subwave of a decline that began on August 10 continues, part of a larger downtrend three steps larger that began on July 27 from 4634.50.
The smaller middle wave and the larger downtrend are both 3rd waves. Each will be followed by a 4th wave upward correction, and then by a final decline that will complete each in turn.
I say “in turn” because it will take time for the various subwaves of the larger downtrend to travel their individual paths to completion. The larger downtrend, as a 3rd wave, can be expected to fall below the start of the preceding 2nd wave, which began on October 13, 2022 from 3622.75. Likely significantly below that price.
In other words, I expect the market to trace a net decline over the next months, with the usual ups and downs in the dance of the subwaves. The 2nd wave lasted for 9-1/2 months. The present 3rd wave downtrend could last longer or could be briefer, but the 2nd wave’s duration at the least gives a rough idea of the magnitude of the ongoing decline.
What are the alternatives? None at present. I’m quite certain that ambiguities will develop, as they always do.
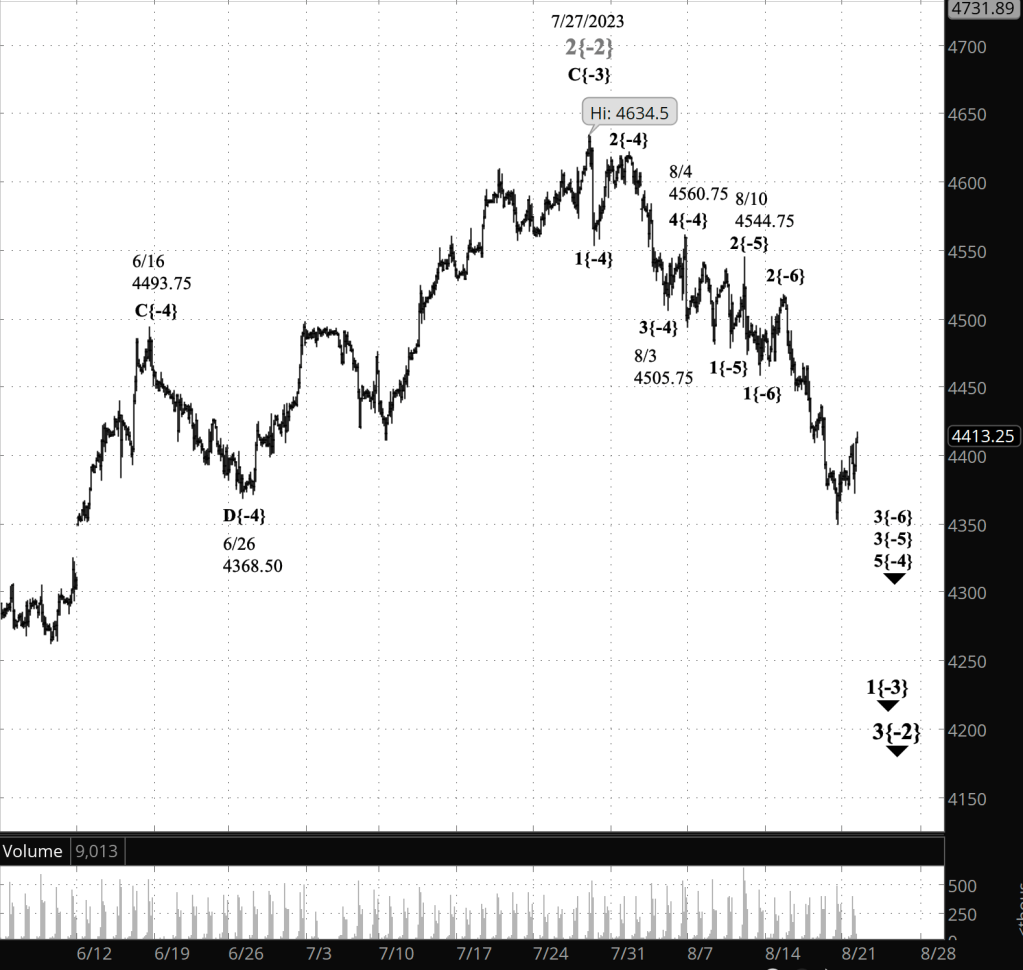
[S&P 500 E-mini futures at 3:30 p.m., 30-minute bars, with volume]
What does Elliott wave theory say? Here are the waves that underly the analyses.
Principal analysis:
- A downward correction, wave 3{-2}, began on July and is underway.
- Internally, the correction is in its first subwave, wave 1{-3}.
- Within wave 1{-3}, wave 5{-4} is underway.
- Within wave 5{-4}, wave 3{-5} is underway, and one degree further down, wave 3{-6} is in progress.
Big picture:
- Both the wave 2{-2} correction and wave 3{-2} downtrend are subwaves of wave 4{-1}, a downtrend that began on January 4, 2022.
- Wave 4{-1}, in turn, is a subwave of wave 5{0}, an expanding Diagonal Triangle that began on December 26, 2018.
- Wave 4{-1} may eventually reach the lower boundary of wave 5{0}, presently slightly below 1800 and declining further each day.
- Wave 4{-1} will be followed by rising wave 5{-1}, the final wave in the Triangle.
We Are Here.
These are the waves currently in progress under my principal analysis. Each line on the list shows the wave number, with the subscript in curly brackets, the traditional degree name, the starting date, the starting price of the S&P 500 E-mini futures, and the direction of the wave.
- S&P 500 Index:
- 5{+3} Supercycle, 7/8/1932, 4.40 (up)
- 5{+2} Cycle, 12/9/1974, 60.96 (up)
- 5{+1} Primary, 3/6/2009, 666.79 (up)
- 5{0} Intermediate, 12/26/2018, 2346.58 (up)
- S&P 500 Futures and index:
- 4{-1} Minor, 1/4/2022, 4953.25 (down) (futures), 4818.62 (down) (index)
- S&P 500 Futures:
- 3{-2} Minute, 7/27/2023, 3502 (down)
Reading the chart. Price movements — waves – – in Elliott wave analysis are labeled with numbers within trending waves and letters with corrective waves. The subscripts — numbers in curly brackets — designate the wave’s degree, which, in Elliott wave analysis, means the relative position of a wave within the larger and smaller structures that make up the chart. R.N. Elliott, who in the 1930s developed the form of analysis that bears his name, viewed the chart as a complex structure of smaller waves nested within larger waves, which in turn are nested within still larger waves. In mathematics it’s called a fractal structure, where at every scale the pattern is similar to the others.
Learning and other resources. Elliott wave analysis provides context, not prophecy. As the 20th century semanticist Alfred Korzybski put it in his book Science and Sanity (1933), “The map is not the territory … The only usefulness of a map depends on similarity of structure between the empirical world and the map.” And I would add, in the ever-changing markets, we can judge that similarity of structure only after the fact.
See the menu page Analytical Methods for a rundown on where to go for information on Elliott wave analysis.
By Tim Bovee, Portland, Oregon, August 21, 2023
Disclaimer
Tim Bovee, Private Trader tracks the analysis and trades of a private trader for his own accounts. Nothing in this blog constitutes a recommendation to buy or sell stocks, options or any other financial instrument. The only purpose of this blog is to provide education and entertainment.
No trader is ever 100 percent successful in his or her trades. Trading in the stock and option markets is risky and uncertain. Each trader must make trading decisions for his or her own account, and take responsibility for the consequences.
License
All content on Tim Bovee, Private Trader by Timothy K. Bovee is licensed under a Creative Commons Attribution-ShareAlike 4.0 International License.
Based on a work at www.timbovee.com.

You must be logged in to post a comment.