3:30 p.m. New York time
Half an hour before the closing bell. The S&P 500 futures rose during the session to 4560.75 and then reversed, falling into the 4490s. In the low-degree labels that I added this morning, the decline marked the end of a small upward correction, wave 4{-5}, and the beginning of the final wave of the series, wave 5{-5}.
Implications for two scenarios:
- The scenario that sees today’s decline as a wave connecting the second corrective pattern with a third such pattern within the larger upward compound correction became less likely as a result of today’s fall. The decline is taking the form of five subwaves, and a connecting wave, wave X{-3}, would have three subwaves.
- The scenario that declares the upward correction to have ended at the July 27 high and the downward movement to be the start of a downtrend, wave 3{-2}, became more likely as a result of today’s fall. A trending wave as five subwaves.
I’ve updated the chart.
9:35 a.m. New York time
What’s happening now? The S&P 500 E-mini futures rose during the earlier hours of the overnight trading, reaching 4547 and then reversed, reaching a low of 4514.25 a few minutes after the latest employment numbers were released. The price remained above yesterday’s low, 4505.75. Shortly after the opening bell. the price exceeded the overnight high, reaching 4548.
What does it mean? Absent new highs or lows, overnight trading did nothing to resolve the ambiguities created when the price retreated from last week’s peak, 4634.50.
What are the ambiguities? Unchanged from yesterday’s Trader’s Notebook. And the analysis that follows is largely unchanged from yesterday’s post.
An upward correction, wave 2{-2} that began on October 13, 2022 has taken a compound form. So far it has produced two corrective patterns.
Within that context, here is an inventory of the ambiguities:
- The decline from July 27 is a subwave of the final wave of the second corrective pattern, which is still underway
- The lower the price falls, the less likely this scenario becomes.
- The second corrective pattern ended at the July 27 peak and the correction continues.
- The decline is a wave that will connect the second corrective pattern with a third and final corrective pattern. This is called an X-wave in classical Elliott wave terminology.
- The upward correction ended at the July 27 peak.
- The decline is the early stage of what will become powerful downtrend that will carry the price below the start of the upward correction, from 3502, and most likely significantly below that level. This would be wave 3{-2}.
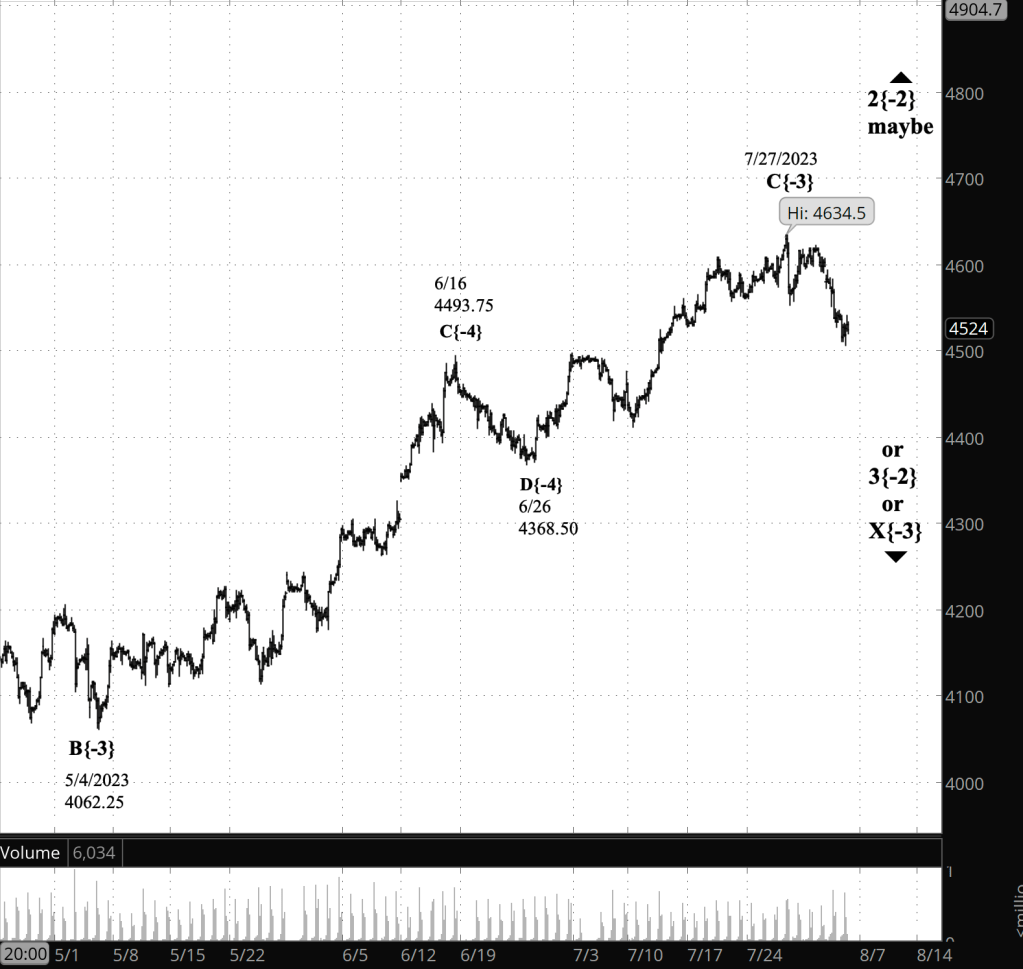
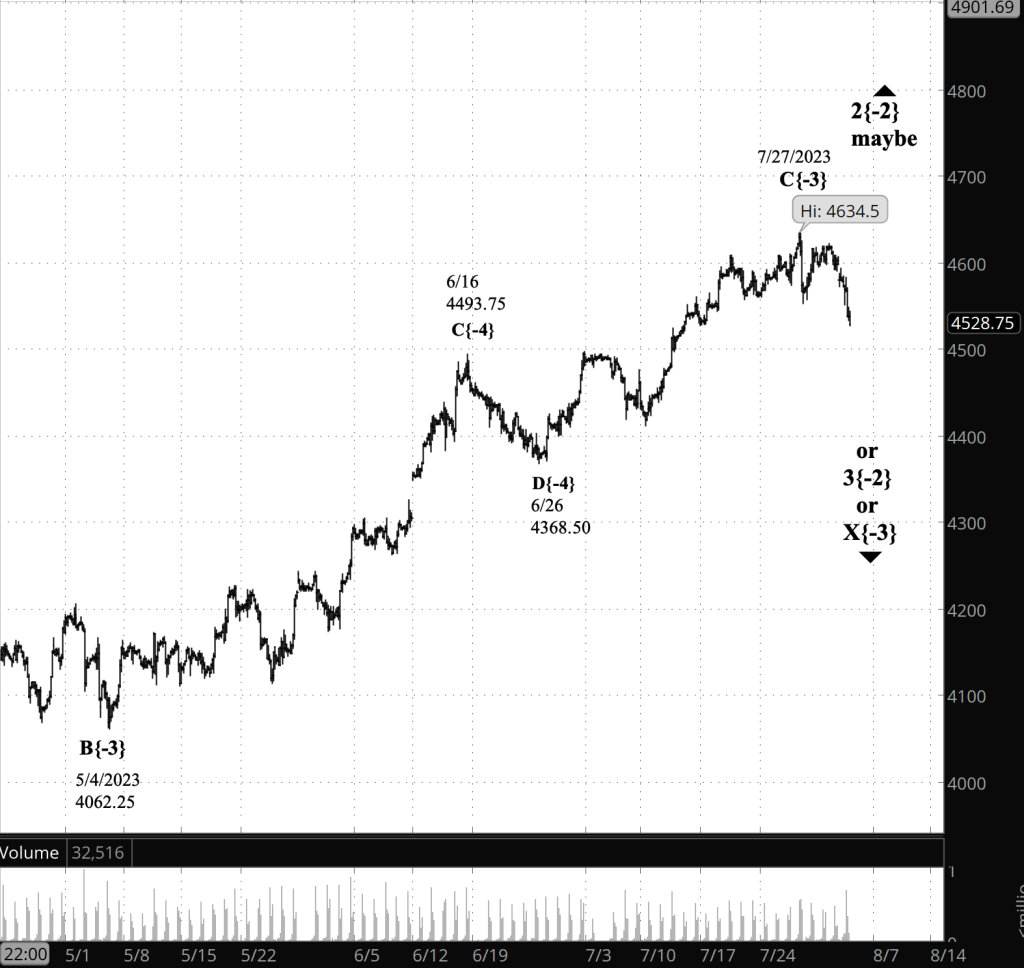
The chart below. The chart shows the final subwave, wave C{-3} of the second corrective pattern within the upward correction, wave 2{-2}.
The decline so far has completed three subwaves, which I’ve placed on the chart as waves 1{-5}, 2{-5} and 3{-5}. The degree subscript, {-5}, is only a guess. There’s not enough context to support anything more precise at this point. It’s probably not larger and might be smaller.

[S&P 500 E-mini futures at 3:30 p.m., 165-minute bars, with volume]
What does Elliott wave theory say? Here are the waves that underly the analysis.
Known facts:
- An upward correction, a Zigzag, wave 2{-2}, began on October 13, 2022 and is underway.
- The upward correction, wave 2{-2}, is taking a compound form, which can contain up to three corrective patterns.
- The correction has completed its second corrective pattern.
Ambiguities
- Is the July 27 peak the end of wave C{-3} within the correction, wave 2{-2}?
- If wave C{-3} has ended, has wave 2{-2} also ended or will it produce a connector, wave X{-3}, and then move on to wave A{-3}, the first wave of a third corrective pattern?
- If wave 2{-2} has ended, a powerful downtrend, wave 3{-3}, is taking its tentative 1st steps.
We Are Here.
These are the waves currently in progress under my principal analysis. Each line on the list shows the wave number, with the subscript in curly brackets, the traditional degree name, the starting date, the starting price of the S&P 500 E-mini futures, and the direction of the wave.
- S&P 500 Index:
- 5{+3} Supercycle, 7/8/1932, 4.40 (up)
- 5{+2} Cycle, 12/9/1974, 60.96 (up)
- 5{+1} Primary, 3/6/2009, 666.79 (up)
- 5{0} Intermediate, 12/26/2018, 2346.58 (up)
- S&P 500 Futures and index:
- 4{-1} Minor, 1/4/2022, 4953.25 (down) (futures), 4818.62 (down) (index)
- S&P 500 Futures:
- 3{-2} Minute, 7/27/2023, 3502 (down) (tenatively)
Reading the chart. Price movements — waves – – in Elliott wave analysis are labeled with numbers within trending waves and letters with corrective waves. The subscripts — numbers in curly brackets — designate the wave’s degree, which, in Elliott wave analysis, means the relative position of a wave within the larger and smaller structures that make up the chart. R.N. Elliott, who in the 1930s developed the form of analysis that bears his name, viewed the chart as a complex structure of smaller waves nested within larger waves, which in turn are nested within still larger waves. In mathematics it’s called a fractal structure, where at every scale the pattern is similar to the others.
Learning and other resources. Elliott wave analysis provides context, not prophecy. As the 20th century semanticist Alfred Korzybski put it in his book Science and Sanity (1933), “The map is not the territory … The only usefulness of a map depends on similarity of structure between the empirical world and the map.” And I would add, in the ever-changing markets, we can judge that similarity of structure only after the fact.
See the menu page Analytical Methods for a rundown on where to go for information on Elliott wave analysis.
By Tim Bovee, Portland, Oregon, August 4, 2023
Disclaimer
Tim Bovee, Private Trader tracks the analysis and trades of a private trader for his own accounts. Nothing in this blog constitutes a recommendation to buy or sell stocks, options or any other financial instrument. The only purpose of this blog is to provide education and entertainment.
No trader is ever 100 percent successful in his or her trades. Trading in the stock and option markets is risky and uncertain. Each trader must make trading decisions for his or her own account, and take responsibility for the consequences.
License
All content on Tim Bovee, Private Trader by Timothy K. Bovee is licensed under a Creative Commons Attribution-ShareAlike 4.0 International License.
Based on a work at www.timbovee.com.


You must be logged in to post a comment.