3:30 p.m. New York time
Half an hour before the closing bell. The S&P 500 futures traced a sideways course during the session, remaining mostly between 4500 and 4520.
The movement was an upward correction of very low degree during the tentative beginning of a downtrend that began on September 1. There is a competing interpretation, outlined this morning, that also has a strong probability, that the upward correction that began on August 18 is taking a compound form and the downtrend has not yet begun.
Also, if the price moves up above 4547.75, the beginning of the downtrend in my principal analysis, then the upward correction is still underway and the downtrend lies in the future.
There is a boatload of ambiguity in this chart, which is almost always the case during a transition from correction to trending.
This morning’s analysis stands. I’ve updated the chart.
9:35 a.m. New York time
What’s happening now? The S&P 500 E-mini futures declined after trading resumed overnight, remaining below the September 1 high, 4547.75.
What does it mean? The fall took the price to within 10 points of the 50% Fibonacci retracement level. The peak in the upward correction that began on August 18 was 20 points above the 61.8% retracement level.
The decline was decisive, in that it consists of three waves, with the 3rd wave being the longest. That is potentially the pattern of a trending wave, and if that’s what it is, then the rising 4th wave, now underway, will be followed by a declining 5th wave that will complete the pattern.
That evidence taken together has persuaded me that the most probable interpretation is that the September 1 peak, 4547.75, was the end of wave C{-4}, the final subwave of the corrective pattern within the upward correction, wave 2{-3}. The decline that followed is an early stage of wave 3{-3}, a powerful downtrend that will eventually carry the price below the start of the upward correction, 4350, and most likely well below that level.
It’s also possible that wave 2{-3} is taking the form of a compound correction, containing two or three corrective patterns. If that’s what’s happening then the decline is wave X{-4}, a wave connecting the first corrective pattern with the future second corrective pattern. Wave X{-4} will remaining above the correction’s starting price, 4350.
I’ve marked the chart based on the scenario that sees 4547.756 as the end of wave 2{-3}, but have indicated the points of ambiguity: Wave 2{-3}, complete or maybe not, and the decline, wave 3{-3} or wave X{-4}.
What are the alternatives? It remains possible that the corrective pattern is not yet complete, that the price will reverse and move above the 4547.75 peak. If that happens, then wave 2{-3} and its subwave, wave C{-4}, are still underway, and wave 3{-3} or wave X{-4} has not yet begun.
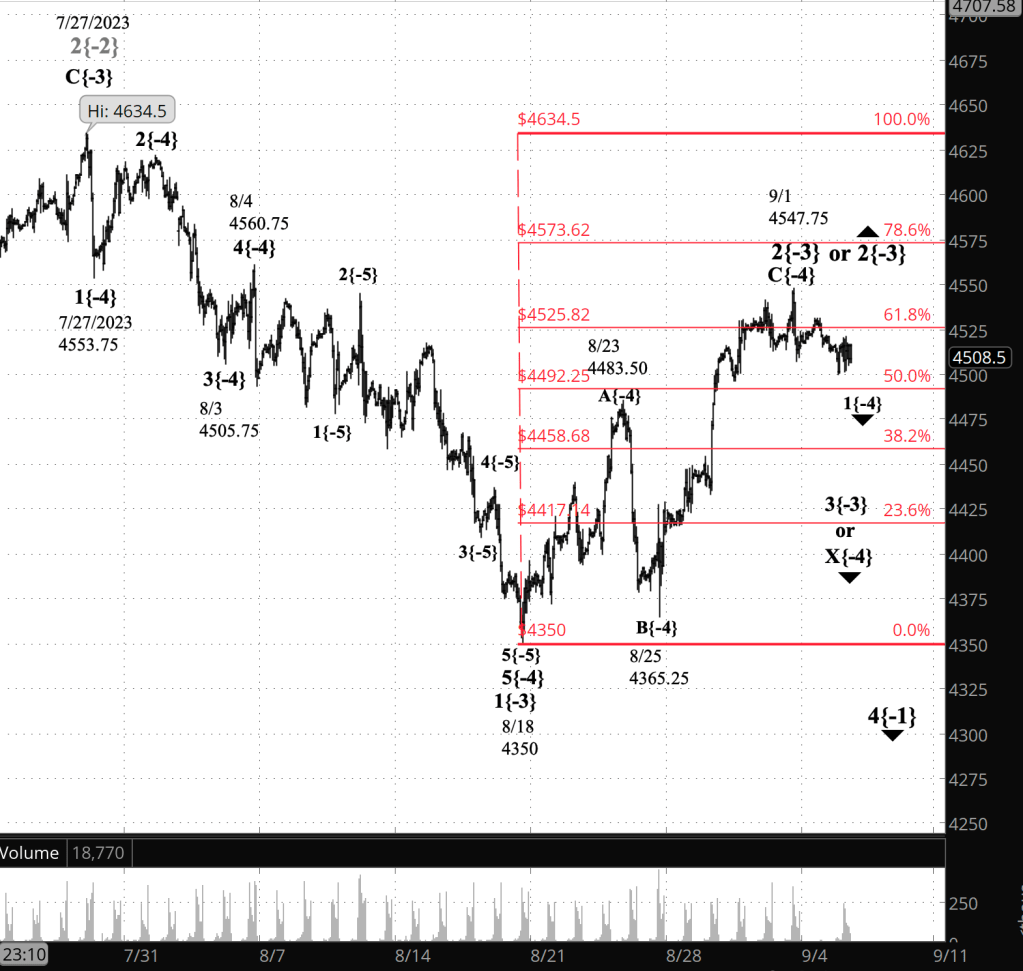
[S&P 500 E-mini futures at 3:30 p.m., 70-minute bars, with volume]
What does Elliott wave theory say? Here are the waves that underly the analyses.
Principal analysis: The corrective pattern has ended.
- A downtrend wave 3{-2}, began on July 27 is underway.
- Internally, wave 3{-2} complete its first subwave, wave 1{-3}, on August 18, and wave 2{-3}, an upward correction, began.
- Two possibilities of nearly equal probability:
- The corrective pattern ended on September 1.
- Wave 3{-3}, a powerful downtrend, began on September 1 and is taking its first tentative steps.
- The corrective pattern continues.
- Wave 2{-3} is still underway and is taking a compound form.
- Declining wave X{-4}, now underway, will connect the first corrective patternwith a second 1.
- The corrective pattern ended on September 1.
Alternative: The corrective pattern is underway.
- Within wave 2{-3}, rising wave C{-4} is underway.
- Within rising wave C{-4}, rising wave E{-5} is underway.
Big picture:
- Both the wave 2{-2} correction and wave 3{-2} downtrend are subwaves of wave 4{-1}, a downtrend that began on January 4, 2022.
- Wave 4{-1}, in turn, is a subwave of wave 5{0}, an expanding Diagonal Triangle that began on December 26, 2018.
- Wave 4{-1} may eventually reach the lower boundary of wave 5{0}, presently slightly below 1800 and declining further each day.
- Wave 4{-1} will be followed by rising wave 5{-1}, the final wave in the Triangle.
We Are Here.
These are the waves currently in progress under my principal analysis. Each line on the list shows the wave number, with the subscript in curly brackets, the traditional degree name, the starting date, the starting price of the S&P 500 E-mini futures, and the direction of the wave.
- S&P 500 Index:
- 5{+3} Supercycle, 7/8/1932, 4.40 (up)
- 5{+2} Cycle, 12/9/1974, 60.96 (up)
- 5{+1} Primary, 3/6/2009, 666.79 (up)
- 5{0} Intermediate, 12/26/2018, 2346.58 (up)
- S&P 500 Futures and index:
- 4{-1} Minor, 1/4/2022, 4953.25 (down) (futures), 4818.62 (down) (index)
- S&P 500 Futures:
- 3{-2} Minute, 7/27/2023, 3502 (down)
Reading the chart. Price movements — waves – – in Elliott wave analysis are labeled with numbers within trending waves and letters with corrective waves. The subscripts — numbers in curly brackets — designate the wave’s degree, which, in Elliott wave analysis, means the relative position of a wave within the larger and smaller structures that make up the chart. R.N. Elliott, who in the 1930s developed the form of analysis that bears his name, viewed the chart as a complex structure of smaller waves nested within larger waves, which in turn are nested within still larger waves. In mathematics it’s called a fractal structure, where at every scale the pattern is similar to the others.
Learning and other resources. Elliott wave analysis provides context, not prophecy. As the 20th century semanticist Alfred Korzybski put it in his book Science and Sanity (1933), “The map is not the territory … The only usefulness of a map depends on similarity of structure between the empirical world and the map.” And I would add, in the ever-changing markets, we can judge that similarity of structure only after the fact.
See the menu page Analytical Methods for a rundown on where to go for information on Elliott wave analysis.
By Tim Bovee, Portland, Oregon, September 5, 2023
Disclaimer
Tim Bovee, Private Trader tracks the analysis and trades of a private trader for his own accounts. Nothing in this blog constitutes a recommendation to buy or sell stocks, options or any other financial instrument. The only purpose of this blog is to provide education and entertainment.
No trader is ever 100 percent successful in his or her trades. Trading in the stock and option markets is risky and uncertain. Each trader must make trading decisions for his or her own account, and take responsibility for the consequences.
License
All content on Tim Bovee, Private Trader by Timothy K. Bovee is licensed under a Creative Commons Attribution-ShareAlike 4.0 International License.
Based on a work at www.timbovee.com.

You must be logged in to post a comment.