3:30 p.m. New York time
Half an hour before the closing bell. During the session the S&P 500 futures moved a bit above the overnight high, into the 4470s, and then dropped back by into the 4450s.
On the chart the new peak became the end point of the small 2nd wave correction, wave 2{-6}. Otherwise, this morning’s analysis is unchanged.
I’ve updated the chart.
9:35 a.m. New York time
What’s happening now? The S&P 500 E-mini futures traded between the 4440s and 4460s overnight.
What does it mean? Now in progress: A 3rd-wave downtrend nested within another 3rd waves of larger size. Third waves tend to be the most energetic part of a trend, and I see a lot of power built into this fractal structure.
In my wave labeling system, the wave number is followed by a subscript showing the degree — the relative position — in the fractal structure. The number shows degrees below what the initial developer of Elliott Wave Theory, R.N. Elliott, called the Intermediate degree. The current Intermediate wave is wave 5{0} in my system, which began on December 26, 2018.
From large to small, the waves are structured like this. The largest wave, 4{-1}, began on January 4, 2022. It is the next to the last wave of an expanding Diagonal Triangle, which is the Intermediate wave, 5{0}.
Next down, the wave labeled 3{-2}, began on June 27 of the present year. Within it, wave 3{-3} began on September 1.
Wave 3{-3} is in its first subwave, wave 1{-4}, which is in its final wave down. That final falling wave, 5{-5}, began on September 6 and is in a 3rd wave, wave 3{-6}.
Wave 3{-6} will soon be followed by an upward correction, wave 4{-6}, and then a final declining wave, 5{-6}, which will complete the parent wave, 5{-5}. The grandparent wave, 3{-4}, will roll into a an upward correction, wave 4{-4}, and then a final downtrending wave 5{-4}.
When wave 5{-4} is complete, it will also be the end of the parent wave 1{-4}, which is only the first wave within wave 3{-3}, which will have four more waves to go.
That’s a lot of downside ahead.
What are the alternatives? A new trending wave presents a labeling problem. The wave itself has a clear position within the fractal hierarchy, but what about the 1st subwave? Is it one degree below the main downtrend, or is it two degrees, or even three? And so while the labeling on wave 1{-4} is clear, the labeling one wave lower on the chart, wave 5{-5}, could in fact be two waves lower, 5{-6}, or even three, 5{-7}. Only the passage of time can sort it out.
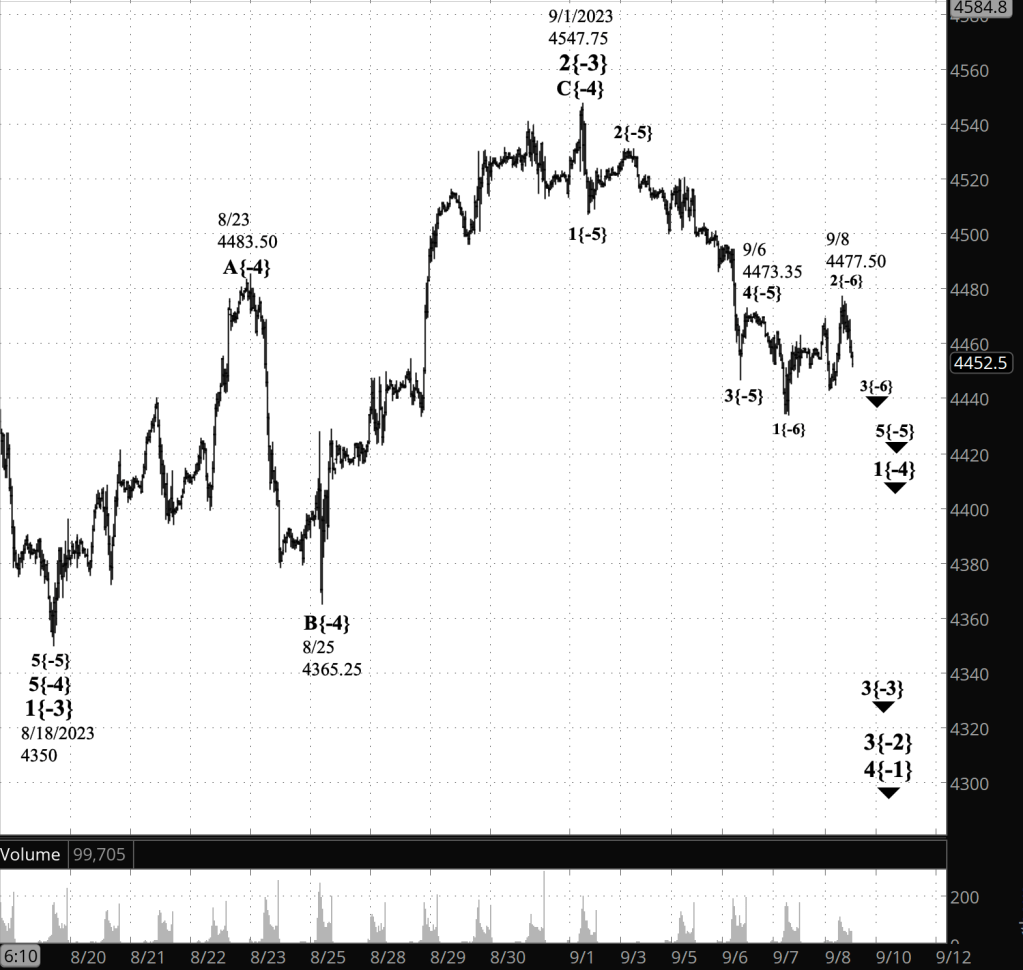
[S&P 500 E-mini futures at 3:30 p.m., 35-minute bars, with volume]
What does Elliott wave theory say? Here are the waves that underly the analyses.
Principal analysis
- A downtrend wave 3{-2}, began on July 27 is underway.
- Internally, wave 3{-2} complete its first subwave, wave 1{-3}, on August 18, and wave 2{-3}, an upward correction, began.
- Wave 3{-3}, a powerful downtrend, began on September 1 and is in its first subwave, wave 1{-4}.
- Wave 1{-4} is in its 5th and final subwave, wave 5{-5}, which began on September 6.
- Internall, wave 5{-5} is in its middle subwave, 3{-6}.
Big picture:
- Both the wave 2{-2} correction and wave 3{-2} downtrend are subwaves of wave 4{-1}, a downtrend that began on January 4, 2022.
- Wave 4{-1}, in turn, is a subwave of wave 5{0}, an expanding Diagonal Triangle that began on December 26, 2018.
- Wave 4{-1} may eventually reach the lower boundary of wave 5{0}, presently slightly below 1800 and declining further each day.
- Wave 4{-1} will be followed by rising wave 5{-1}, the final wave in the Triangle.
We Are Here.
These are the waves currently in progress under my principal analysis. Each line on the list shows the wave number, with the subscript in curly brackets, the traditional degree name, the starting date, the starting price of the S&P 500 E-mini futures, and the direction of the wave.
- S&P 500 Index:
- 5{+3} Supercycle, 7/8/1932, 4.40 (up)
- 5{+2} Cycle, 12/9/1974, 60.96 (up)
- 5{+1} Primary, 3/6/2009, 666.79 (up)
- 5{0} Intermediate, 12/26/2018, 2346.58 (up)
- S&P 500 Futures and index:
- 4{-1} Minor, 1/4/2022, 4953.25 (down) (futures), 4818.62 (down) (index)
- S&P 500 Futures:
- 3{-2} Minute, 7/27/2023, 3502 (down)
Reading the chart. Price movements — waves – – in Elliott wave analysis are labeled with numbers within trending waves and letters with corrective waves. The subscripts — numbers in curly brackets — designate the wave’s degree, which, in Elliott wave analysis, means the relative position of a wave within the larger and smaller structures that make up the chart. R.N. Elliott, who in the 1930s developed the form of analysis that bears his name, viewed the chart as a complex structure of smaller waves nested within larger waves, which in turn are nested within still larger waves. In mathematics it’s called a fractal structure, where at every scale the pattern is similar to the others.
Learning and other resources. Elliott wave analysis provides context, not prophecy. As the 20th century semanticist Alfred Korzybski put it in his book Science and Sanity (1933), “The map is not the territory … The only usefulness of a map depends on similarity of structure between the empirical world and the map.” And I would add, in the ever-changing markets, we can judge that similarity of structure only after the fact.
See the menu page Analytical Methods for a rundown on where to go for information on Elliott wave analysis.
By Tim Bovee, Portland, Oregon, September 8, 2023
Disclaimer
Tim Bovee, Private Trader tracks the analysis and trades of a private trader for his own accounts. Nothing in this blog constitutes a recommendation to buy or sell stocks, options or any other financial instrument. The only purpose of this blog is to provide education and entertainment.
No trader is ever 100 percent successful in his or her trades. Trading in the stock and option markets is risky and uncertain. Each trader must make trading decisions for his or her own account, and take responsibility for the consequences.
License
All content on Tim Bovee, Private Trader by Timothy K. Bovee is licensed under a Creative Commons Attribution-ShareAlike 4.0 International License.
Based on a work at www.timbovee.com.

You must be logged in to post a comment.