3:30 p.m. New York time
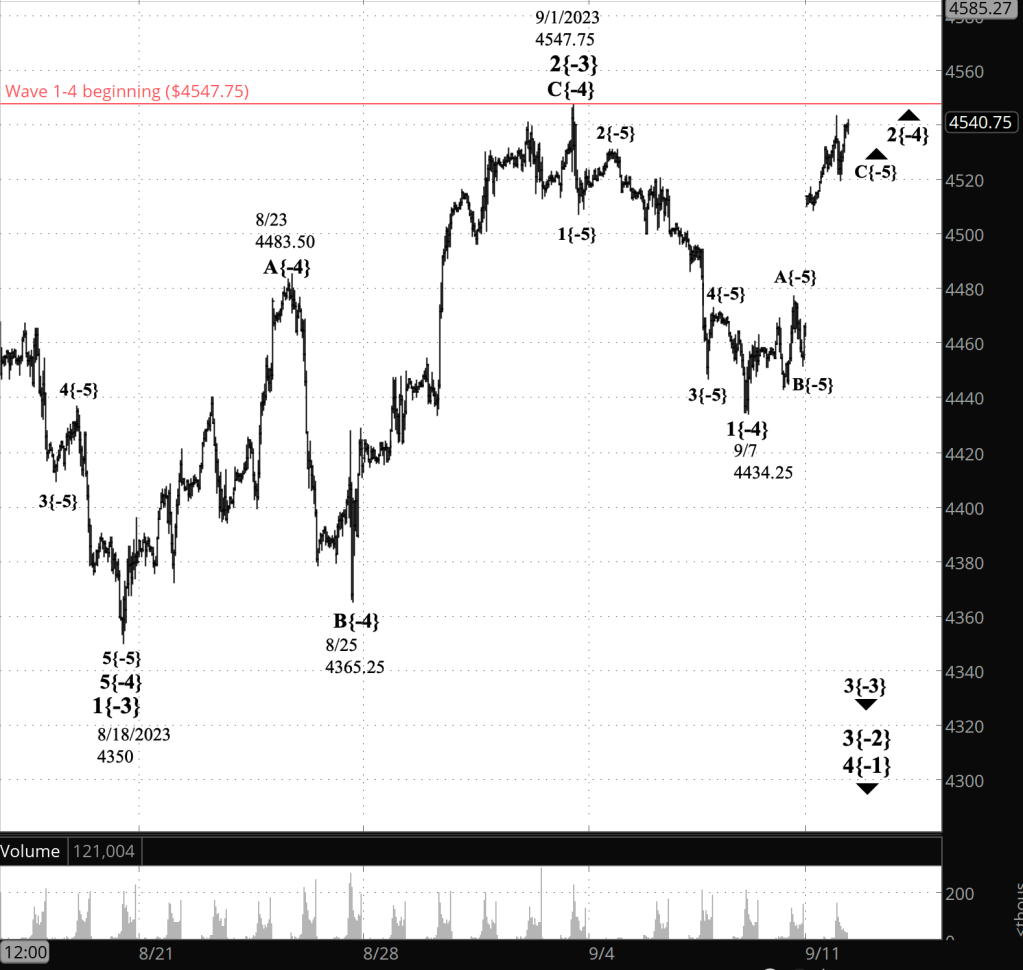
Half an hour before the closing bell. The S&P 500 futures reached a session high, so far, of 4543.50, shortly after the opening bell. It then fell back to just below 4520, and rose again.
The movement, designated as a 2nd wave upward correction in Elliott Wave Theory, remained below the starting point of the preceding 1st wave, 4547.75. If the price move above that level, the analysis as it stands now would no longer matche the chart and would be redone.
Meanwhile, this morning’s analysis still stands. I’ve updated the chart.
9:35 a.m. New York time
What’s happening now? When trading resumed overnight, the S&P 500 E-mini futures gapped up by 50 points, at 4514 or a bit more than 1%, and continued to rise, reaching into the 4530s.
What does it mean? The rise invalidates the chart analysis posted on Friday, September 9. Here is how the analysis has changed:
- The decline from September 1 is raised by one degree, from {-5} to {-4}.
- The low on September 7 becomes the end of wave 1{-4} within downtrending wave 3{-3}.
- The gap is the starting point of the 3rd and wave within an upward correction, wave 2{-4}, which is still underway. Maybe. I don’t have great confidence in the labeling of the subwaves within wave 2{-4}.
Under the rules of Elliott Wave Theory, a 2nd wave cannot move above the starting point of the preceding 1st wave, which is 4547.75. If the price does move above that level, then it isn’t a 2nd wave and something else is going on. I’ve marked that level on the chart with a red line.
Caveats: This chart is of the futures, which moves in 25-cent increments. The S&P 500 index moves in 1-cent increments. So it’s possible for a 2nd wave on the futures to move above the start of the preceding 1st wave while the index stays below that level.
If that should happen, then it’s an ambiguity that can only be resolved by the subsequent movement of the price. That’s a long way of saying that the chart has the final say in the matter. What the market does is the territory, and the chart analysis is a map. If the map doesn’t match the territory, then the map must be changed, as is the case today.
Assuming wave 2{-4} remains a valid analysis, it will end soon and will be followed by a wave 3{-4}, a powerful downtrend that will carry the price back to the 4430s and likely quite a distance below that level.
What are the alternatives? It’s possible to count the rise from September 7 as being the 1st subwave within the correction. This scenario leaves a downwave and the a final rising wave to go, with very llittle room for the rising wave to rise.
Reading the chart. Price movements — waves – – in Elliott wave analysis are labeled with numbers within trending waves and letters with corrective waves. The subscripts — numbers in curly brackets — designate the wave’s degree, which, in Elliott wave analysis, means the relative position of a wave within the larger and smaller structures that make up the chart. R.N. Elliott, who in the 1930s developed the form of analysis that bears his name, viewed the chart as a complex structure of smaller waves nested within larger waves, which in turn are nested within still larger waves. In mathematics it’s called a fractal structure, where at every scale the pattern is similar to the others.
[S&P 500 E-mini futures at 3:30 p.m., 40-minute bars, with volume]
What does Elliott wave theory say? Here are the waves that underly the analyses.
Principal analysis
- A downtrend wave 3{-2}, began on July 27 is underway.
- Within wave 3{-2}, wave 3{-3}, a powerful downtrend, began on September 1 and is in its second subwave, wave 2{-4}, which is an upward correction.
- Wave 2{-4} is in its 3rd subwave, rising wave C{-5}
Alternative analysis
- Wave 2{-4} is in its 1st subwave, rising wave A{-5}
Big picture:
- Both the wave 2{-2} correction and wave 3{-2} downtrend are subwaves of wave 4{-1}, a downtrend that began on January 4, 2022.
- Wave 4{-1}, in turn, is a subwave of wave 5{0}, an expanding Diagonal Triangle that began on December 26, 2018.
- Wave 4{-1} may eventually reach the lower boundary of wave 5{0}, presently slightly below 1800 and declining further each day.
- Wave 4{-1} will be followed by rising wave 5{-1}, the final wave in the Triangle.
We Are Here.
These are the waves currently in progress under my principal analysis. Each line on the list shows the wave number, with the subscript in curly brackets, the traditional degree name, the starting date, the starting price of the S&P 500 E-mini futures, and the direction of the wave.
- S&P 500 Index:
- 5{+3} Supercycle, 7/8/1932, 4.40 (up)
- 5{+2} Cycle, 12/9/1974, 60.96 (up)
- 5{+1} Primary, 3/6/2009, 666.79 (up)
- 5{0} Intermediate, 12/26/2018, 2346.58 (up)
- S&P 500 Futures and index:
- 4{-1} Minor, 1/4/2022, 4953.25 (down) (futures), 4818.62 (down) (index)
- S&P 500 Futures:
- 3{-2} Minute, 7/27/2023, 3502 (down)
Learning and other resources. Elliott wave analysis provides context, not prophecy. As the 20th century semanticist Alfred Korzybski put it in his book Science and Sanity (1933), “The map is not the territory … The only usefulness of a map depends on similarity of structure between the empirical world and the map.” And I would add, in the ever-changing markets, we can judge that similarity of structure only after the fact.
See the menu page Analytical Methods for a rundown on where to go for information on Elliott wave analysis.
By Tim Bovee, Portland, Oregon, September 11, 2023
Disclaimer
Tim Bovee, Private Trader tracks the analysis and trades of a private trader for his own accounts. Nothing in this blog constitutes a recommendation to buy or sell stocks, options or any other financial instrument. The only purpose of this blog is to provide education and entertainment.
No trader is ever 100 percent successful in his or her trades. Trading in the stock and option markets is risky and uncertain. Each trader must make trading decisions for his or her own account, and take responsibility for the consequences.
License
All content on Tim Bovee, Private Trader by Timothy K. Bovee is licensed under a Creative Commons Attribution-ShareAlike 4.0 International License.
Based on a work at www.timbovee.com.

You must be logged in to post a comment.