3:30 p.m. New York time
Half an hour before the closing bell. The S&P 500 futures traded narrowly during the session, staying between almost 4380 and almost 4340.
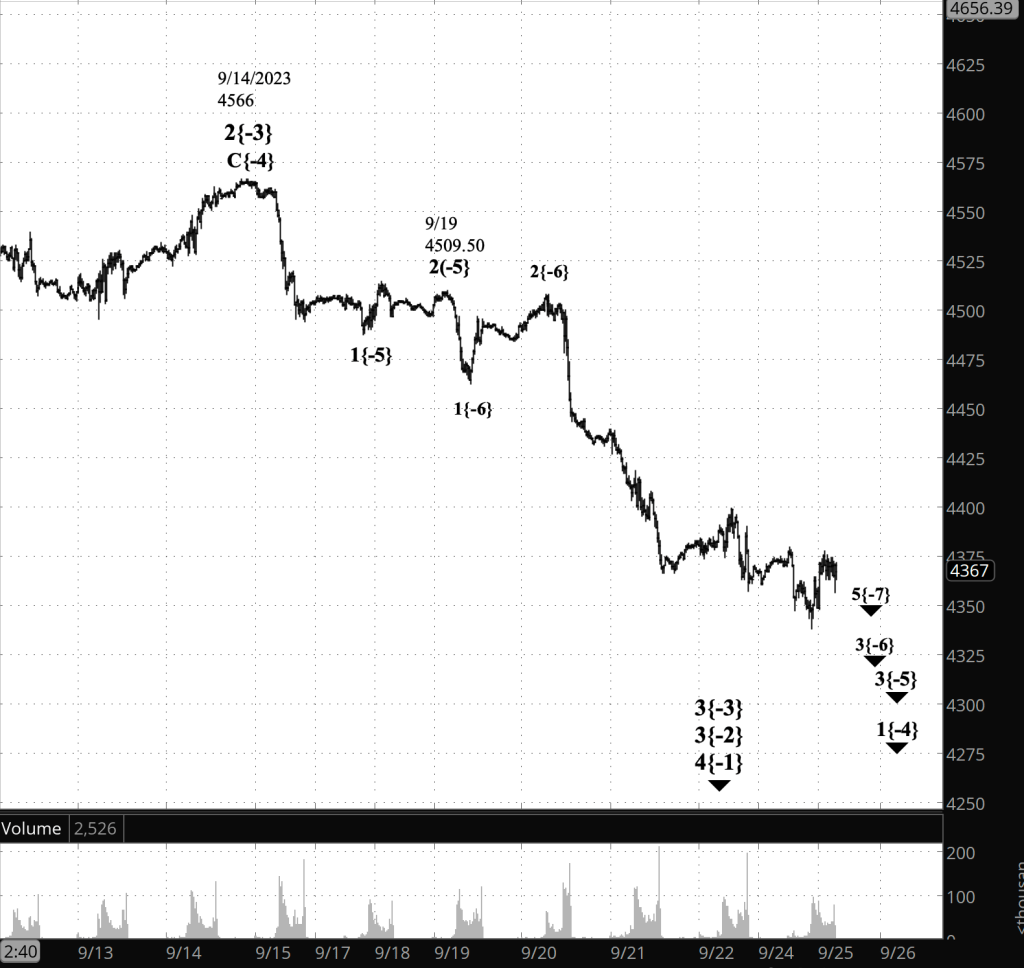
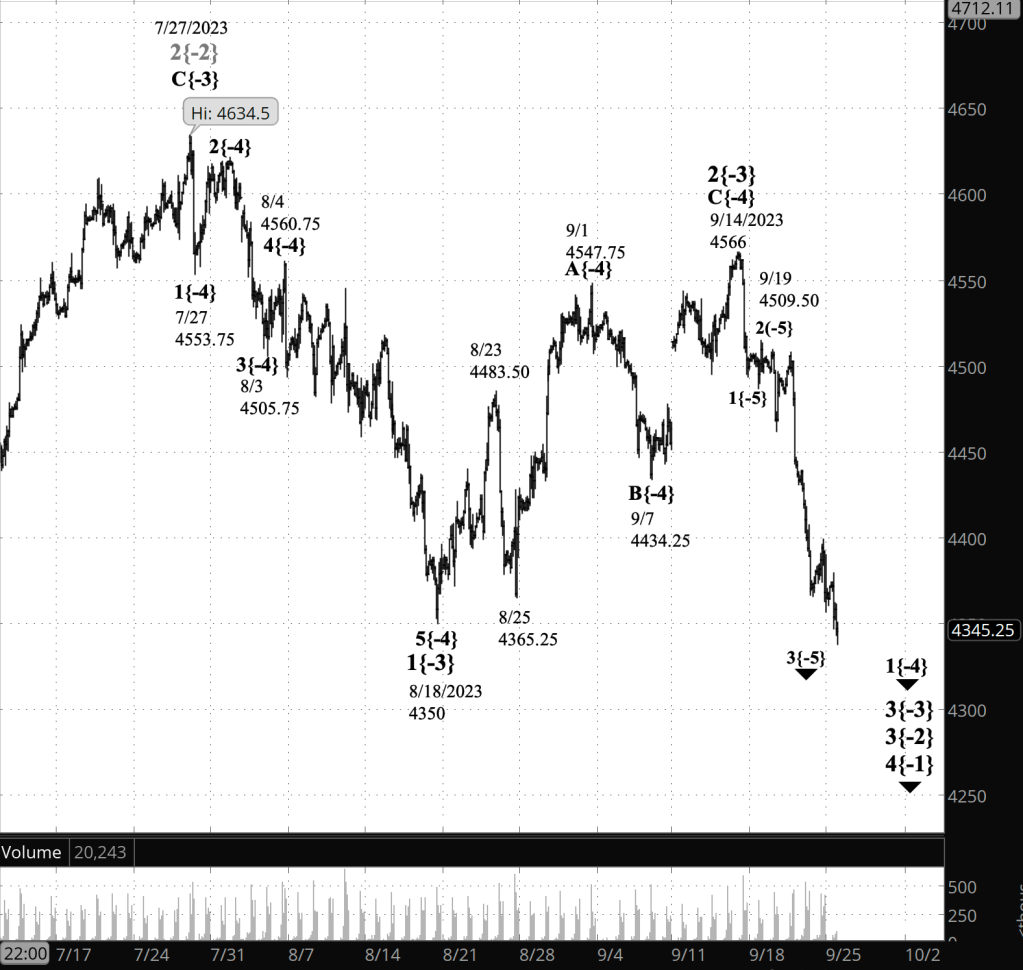
I’ve added a second chart focusing more closely on the 3rd wave downtrend that began on September 14. For comparison I’ve retained this morning’s chart, which has a longer view that includes the larger 3rd wave downtrend that began on July 27.
The close-up chart includes more detailed wave numberings one degree lower than the morning chart.
Long story short, the 3rd wave downtrend that began on September 14 internally is in its 1st subwave, which is in its 3rd subwave, which in turn is in its 3rd subwave. After the 1st wave one degree down from the September 14 trend as a whole, its 3rds down two more degrees.
This morning’s analysis is unchanged.
[S&P 500 E-mini futures at 12:30 p.m., 20-minute bars, with volume]
10:15 a.m. New York time
SPY bear call spread entry. I have entered a short bear call spread on SPY, using options that expire on November 17, and have posted an analysis of the trade.
9:35 a.m. New York time
What’s happening now? The S&P 500 futures fell below 4350, the start of the month-long upward correction. Elliott wave theory confirms that a powerful 3rd-wave decline is underway.
It joined both the S&P 500 index and the exchange-traded fund that tracks the index, SPY, in declining below the start of the 2nd-wave correction that began on August 18.
The break below that level redefined the game, and I have reanalyzed the chart.
What does it mean? The move below 4350 on the futures breaks a firm rule in Elliott Wave Theory. The correction took the form of a Zigzag (5 subaves the 1st subwave, 3 in the second, and 5 in the 3rd). A Zigzag correction cannot move beyond the end of the preceding 1st wave. If it does, then something else is going on.
All three of the three major measures of the S&P 500 have broken below the start of the 2nd wave correction.
Here’s the new map of the terrain: The 2nd wave upward correction that began on August 18 ended on September 14. A powerful 3rd wave downtrend began at that point and is presently in its 1st subwave. The 1st subwave, in turn, is in its 3rd subwave, the middle wave of five.
Friday’s Trader’s Notebook, like those all week, had the correction as still being underway, while acknowledging the ambiguity of the chart at that moment with a number of alternative possibilities. With the fall below the correction’s starting point, the ambiguity disappears. The downtrend is underway. The alternative analysis first posted on Monday, September 18, is the better match for the chart.
What are the alternatives? Always when a trend is in its early stages, the position of a wave within the vast fractal structure of a chart is ambiguous. I’ve chosen to treat the downtrend that began on September 14 as being in its 1st subwave, one degree lower. It’s possible that the count one degree lower is in fact be one degree higher, meaning that the downtrend is in its 3rd subwave. Or everything within 1st subwave could in fact be in its own 1st subwave, moving the smaller waves down a level.
The relative positioning will become clear as the trend develops.
[S&P 500 E-mini futures at 9:35 a.m., 2-hour bars, with volume]
What does Elliott wave theory say? Here are the waves that underly the analyses.
Principal Analysis:
- A downtrend, wave 3{-2}, began on July 27 and is underway.
- Within wave 3{-2}, a smaller downtrend, wave 3{-3}, began on September 14 and is in its initial subwave, wave 1{-4}.
- With wave 1{-4}, subwave 3{-5} is underway, having begun on September 1.
- Wave 3{-5} is in its middle subwave, wave 3{-6}.
Alternative Analysis #1
- Within wave 3{-3}, wave 3{-4} began on September 19.
Alternative Analysis #2
- Within wave 3{-3}, wave 1{-4} began on September 19, and its subwave, wave 1{-5}, is underway.
Big picture:
- The wave 3{-2} downtrend is a subwave of wave 4{-1}, a downtrend that began on January 4, 2022.
- Wave 4{-1}, in turn, is a subwave of wave 5{0}, an expanding Diagonal Triangle that began on December 26, 2018.
- Wave 4{-1} may eventually reach the lower boundary of wave 5{0}, presently slightly below 1800 and declining further each day.
- Wave 4{-1} will be followed by rising wave 5{-1}, the final wave in the Triangle.
We Are Here.
These are the waves currently in progress under my principal analysis. Each line on the list shows the wave number, with the subscript in curly brackets, the traditional degree name, the starting date, the starting price of the S&P 500 E-mini futures, and the direction of the wave.
- S&P 500 Index:
- 5{+3} Supercycle, 7/8/1932, 4.40 (up)
- 5{+2} Cycle, 12/9/1974, 60.96 (up)
- 5{+1} Primary, 3/6/2009, 666.79 (up)
- 5{0} Intermediate, 12/26/2018, 2346.58 (up)
- S&P 500 Futures and index:
- 4{-1} Minor, 1/4/2022, 4953.25 (down) (futures), 4818.62 (down) (index)
- S&P 500 Futures:
- 3{-2} Minute, 7/27/2023, 3502 (down)
Reading the chart. Price movements — waves – – in Elliott wave analysis are labeled with numbers within trending waves and letters with corrective waves. The subscripts — numbers in curly brackets — designate the wave’s degree, which, in Elliott wave analysis, means the relative position of a wave within the larger and smaller structures that make up the chart. R.N. Elliott, who in the 1930s developed the form of analysis that bears his name, viewed the chart as a complex structure of smaller waves nested within larger waves, which in turn are nested within still larger waves. In mathematics it’s called a fractal structure, where at every scale the pattern is similar to the others.
Learning and other resources. Elliott wave analysis provides context, not prophecy. As the 20th century semanticist Alfred Korzybski put it in his book Science and Sanity (1933), “The map is not the territory … The only usefulness of a map depends on similarity of structure between the empirical world and the map.” And I would add, in the ever-changing markets, we can judge that similarity of structure only after the fact.
See the menu page Analytical Methods for a rundown on where to go for information on Elliott wave analysis.
By Tim Bovee, Portland, Oregon, September 25, 2023
Disclaimer
Tim Bovee, Private Trader tracks the analysis and trades of a private trader for his own accounts. Nothing in this blog constitutes a recommendation to buy or sell stocks, options or any other financial instrument. The only purpose of this blog is to provide education and entertainment.
No trader is ever 100 percent successful in his or her trades. Trading in the stock and option markets is risky and uncertain. Each trader must make trading decisions for his or her own account, and take responsibility for the consequences.
License
All content on Tim Bovee, Private Trader by Timothy K. Bovee is licensed under a Creative Commons Attribution-ShareAlike 4.0 International License.
Based on a work at www.timbovee.com.

You must be logged in to post a comment.