3:30 p.m. New York time
Half an hour before the closing bell. The S&P 500 futures fell during the session, reaching below 4310. A small downtrend that began on September 22 is nearing its end. It is a subwave within a much larger downtrend that began on September 14. I’ve tinkered a bit with the small-wave labeling, changing wave 3{-6} to 5{-6}, and have updated the chart.
9:35 a.m. New York time
What’s happening now? The S&P 500 E-mini futures fell from the 4380s to the 4340s in the early hours of overnight trading, and then traded narrowly in the 4350s and 4360s as the opening bell drew closer.
What does it mean? The pause is a 4th wave upward correction, part of a small downtrending subwave within the larger downtrend that began on September 14 from 4566. The larger downtrend is in its 1st wave, and internally, that 1st wave is in its 3rd subwave.
A trend has five subwaves, and 1st waves are often the shortest of the three internal waves moving in the direction of the trend. Also, 3rd waves are often the longest and — a firm rule — never the shortest.
What are the alternatives? This alternatives, identical to yesterday’s, will be with us for awhile.
Always when a trend is in its early stages, the position of a wave within the vast fractal structure of a chart is ambiguous. I’ve chosen to treat the downtrend that began on September 14 as being in its 1st subwave, one degree lower. It’s possible that the count one degree lower is in fact be one degree higher, meaning that the downtrend is in its 3rd subwave. Or everything within 1st subwave could in fact be in its own 1st subwave, moving the smaller waves down a level.
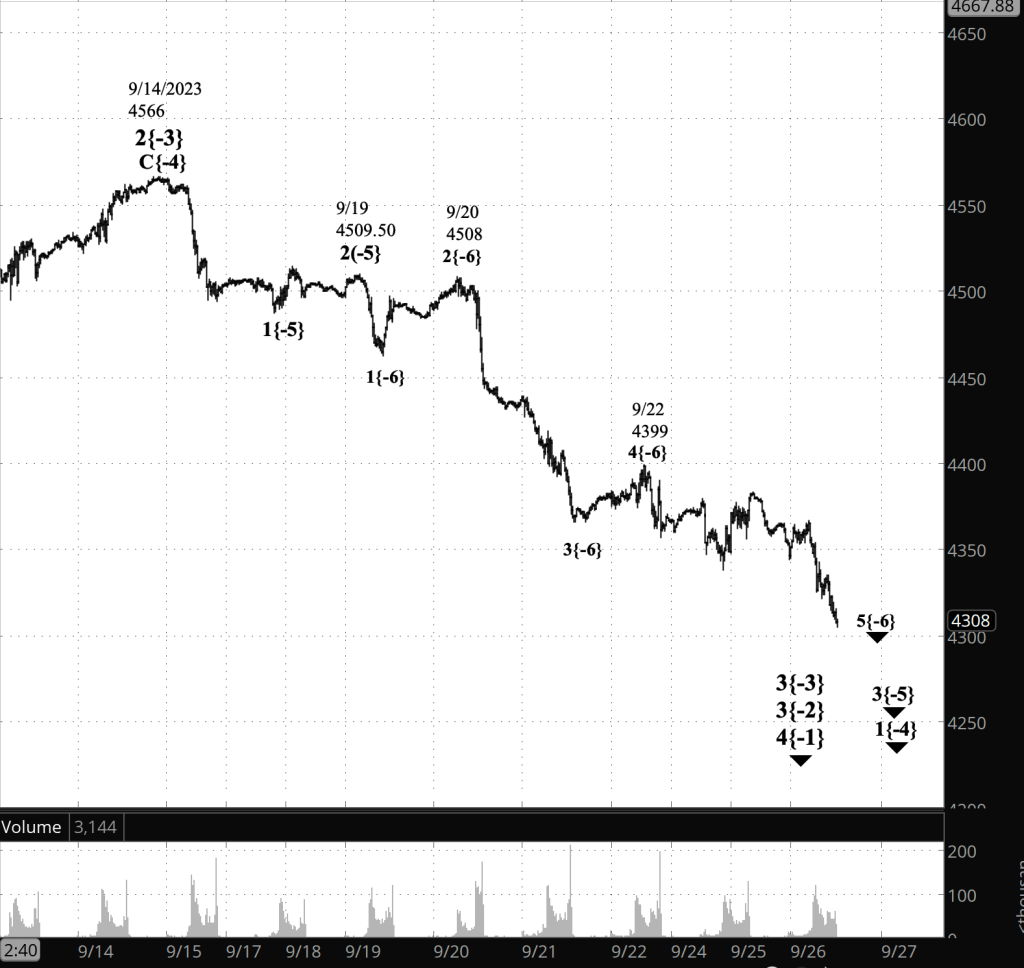
[S&P 500 E-mini futures at 3:30 p.m., 20-minute bars, with volume]
What does Elliott wave theory say? Here are the waves that underly the analyses.
Principal Analysis:
- A downtrend, wave 3{-2}, began on July 27 and is underway.
- Within wave 3{-2}, a smaller downtrend, wave 3{-3}, began on September 14 and is in its initial subwave, wave 1{-4}.
- With wave 1{-4}, subwave 3{-5} is underway, having begun on September 1.
- Wave 3{-5} is in its final subwave, wave 5{-6}.
Alternative Analysis #1
- Within wave 3{-3}, wave 3{-4} began on September 19.
Alternative Analysis #2
- Within wave 3{-3}, wave 1{-4} began on September 19, and its subwave, wave 1{-5}, is underway.
Big picture:
- The wave 3{-2} downtrend is a subwave of wave 4{-1}, a downtrend that began on January 4, 2022.
- Wave 4{-1}, in turn, is a subwave of wave 5{0}, an expanding Diagonal Triangle that began on December 26, 2018.
- Wave 4{-1} may eventually reach the lower boundary of wave 5{0}, presently slightly below 1800 and declining further each day.
- Wave 4{-1} will be followed by rising wave 5{-1}, the final wave in the Triangle.
We Are Here.
These are the waves currently in progress under my principal analysis. Each line on the list shows the wave number, with the subscript in curly brackets, the traditional degree name, the starting date, the starting price of the S&P 500 E-mini futures, and the direction of the wave.
- S&P 500 Index:
- 5{+3} Supercycle, 7/8/1932, 4.40 (up)
- 5{+2} Cycle, 12/9/1974, 60.96 (up)
- 5{+1} Primary, 3/6/2009, 666.79 (up)
- 5{0} Intermediate, 12/26/2018, 2346.58 (up)
- S&P 500 Futures and index:
- 4{-1} Minor, 1/4/2022, 4953.25 (down) (futures), 4818.62 (down) (index)
- S&P 500 Futures:
- 3{-2} Minute, 7/27/2023, 3502 (down)
Reading the chart. Price movements — waves – – in Elliott wave analysis are labeled with numbers within trending waves and letters with corrective waves. The subscripts — numbers in curly brackets — designate the wave’s degree, which, in Elliott wave analysis, means the relative position of a wave within the larger and smaller structures that make up the chart. R.N. Elliott, who in the 1930s developed the form of analysis that bears his name, viewed the chart as a complex structure of smaller waves nested within larger waves, which in turn are nested within still larger waves. In mathematics it’s called a fractal structure, where at every scale the pattern is similar to the others.
Learning and other resources. Elliott wave analysis provides context, not prophecy. As the 20th century semanticist Alfred Korzybski put it in his book Science and Sanity (1933), “The map is not the territory … The only usefulness of a map depends on similarity of structure between the empirical world and the map.” And I would add, in the ever-changing markets, we can judge that similarity of structure only after the fact.
See the menu page Analytical Methods for a rundown on where to go for information on Elliott wave analysis.
By Tim Bovee, Portland, Oregon, September 26, 2023
Disclaimer
Tim Bovee, Private Trader tracks the analysis and trades of a private trader for his own accounts. Nothing in this blog constitutes a recommendation to buy or sell stocks, options or any other financial instrument. The only purpose of this blog is to provide education and entertainment.
No trader is ever 100 percent successful in his or her trades. Trading in the stock and option markets is risky and uncertain. Each trader must make trading decisions for his or her own account, and take responsibility for the consequences.
License
All content on Tim Bovee, Private Trader by Timothy K. Bovee is licensed under a Creative Commons Attribution-ShareAlike 4.0 International License.
Based on a work at www.timbovee.com.

You must be logged in to post a comment.