3:30 p.m. New York time
Half an hour before the closing bell. The S&P 500 futures traded narrowly during the session, between the 4250s and the 4290s, adding a bit more distance to the rise that began on October 3. The movement is consistent with wave C within the 4th wave upward correction, requiring no change to this morning’s analysis.
I’ve updated the chart.
9:35 a.m. New York time
What’s happening now? The S&P 500 E-mini futures rose overnight, from 4235.50 into the 4280s.
What does it mean? The 4th-wave upward correction that began on September 27 has begun the final subwave of the corrective pattern, the C wave. Maybe. There are ambiguities.
In yesterday afternoon’s post I described two equally likely scenarios based on a chart that lacked clarity in the wave count.
If the overnight rise continues, it lends credibility to the B-wave scenario: The decline from September 29 was the middle subwave of a 4th wave upward correction that began on September 27. The overnight rise is wave C.
Had the price continued to decline, it would have increased the credibility of the 5th wave scenario: The upward correction ended on September 29 and the decline that followed is a 5th wave downtrend. If it reverses from its present level and declines further, that will also lend strengthen the case for the 5th wave.
The low point of the B-wave decline, 4235.50, is close to a 130% retracement of the A wave. B waves tracing a Flat pattern typically retrace 100% to 138% of the A wave. So the retracement a point in favor of the B-wave scenario.
But there are problems. The A-wave rise from February 27 appears to have five subwaves, which is characteristic of a Zigzag pattern and is not characteristic of a 4th wave. And the decline from September 29 appears to have five subwaves, which is characteristic of a 5th wave but not of a B wave, whether the pattern is a Flat or a Zigzag.
Waves sometimes (often?) lack clarity and can be interpreted several different ways. Given the lack of clarity on this chart, I’m sticking with the B-wave scenario but will quickly switch to the 5th-wave scenario if the decline resumes and carries the price a good distane below 4206, the 138% retracement level.
What are the alternatives? As the chart lacks clarity, every possibility is an alternative. I’ve picked the B-wave scenario for the chart and so am calling it the Principal Analysis. But both scenarios are equally likely.
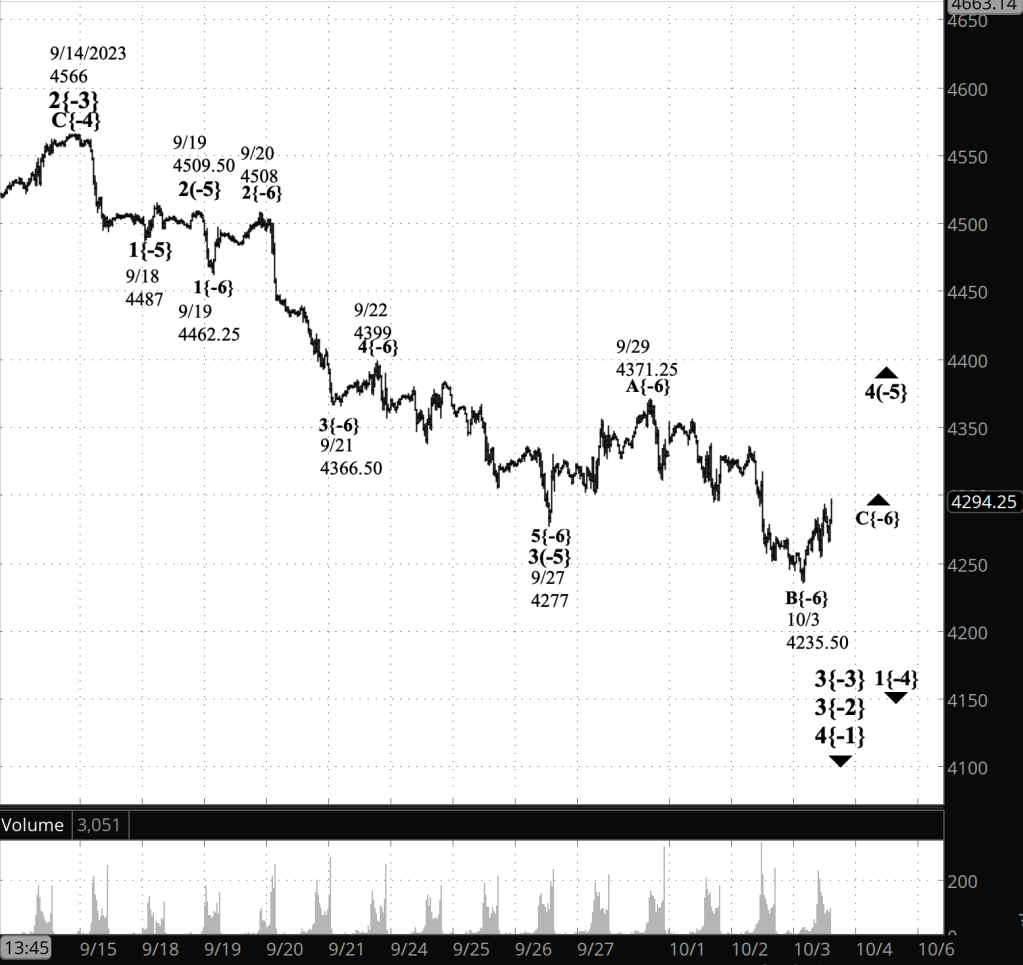
[S&P 500 E-mini futures at 3:30 p.m., 35-minute bars, with volume]
What does Elliott wave theory say? Here are the waves that underly the analyses.
Principal Analysis:
- A downtrend, wave 3{-2}, began on July 27 and is underway.
- Within wave 3{-2}, a smaller downtrend, wave 3{-3}, began on September 14 and is in its initial subwave, wave 1{-4}.
The B-wave scenario:
- With wave 1{-4}, subwave 4{-5}, an upward correction, is underway, having begun on September 27 from 4277.
- Wave B{-6} within wave 4{-5} ended on October 3 and rising wave C{-6} is underway.
The 5th wave scenario:
- Downtrending wave 5{-5} is underway, having begun on September 29 from 4371.25.
Big picture:
- The wave 3{-2} downtrend is a subwave of wave 4{-1}, a downtrend that began on January 4, 2022.
- Wave 4{-1}, in turn, is a subwave of wave 5{0}, an expanding Diagonal Triangle that began on December 26, 2018.
- Wave 4{-1} may eventually reach the lower boundary of wave 5{0}, presently slightly below 1800 and declining further each day.
- Wave 4{-1} will be followed by rising wave 5{-1}, the final wave in the Triangle.
We Are Here.
These are the waves currently in progress under my principal analysis. Each line on the list shows the wave number, with the subscript in curly brackets, the traditional degree name, the starting date, the starting price of the S&P 500 E-mini futures, and the direction of the wave.
- S&P 500 Index:
- 5{+3} Supercycle, 7/8/1932, 4.40 (up)
- 5{+2} Cycle, 12/9/1974, 60.96 (up)
- 5{+1} Primary, 3/6/2009, 666.79 (up)
- 5{0} Intermediate, 12/26/2018, 2346.58 (up)
- S&P 500 Futures and index:
- 4{-1} Minor, 1/4/2022, 4953.25 (down) (futures), 4818.62 (down) (index)
- S&P 500 Futures:
- 3{-2} Minute, 7/27/2023, 3502 (down)
Reading the chart. Price movements — waves – – in Elliott wave analysis are labeled with numbers within trending waves and letters with corrective waves. The subscripts — numbers in curly brackets — designate the wave’s degree, which, in Elliott wave analysis, means the relative position of a wave within the larger and smaller structures that make up the chart. R.N. Elliott, who in the 1930s developed the form of analysis that bears his name, viewed the chart as a complex structure of smaller waves nested within larger waves, which in turn are nested within still larger waves. In mathematics it’s called a fractal structure, where at every scale the pattern is similar to the others.
Learning and other resources. Elliott wave analysis provides context, not prophecy. As the 20th century semanticist Alfred Korzybski put it in his book Science and Sanity (1933), “The map is not the territory … The only usefulness of a map depends on similarity of structure between the empirical world and the map.” And I would add, in the ever-changing markets, we can judge that similarity of structure only after the fact.
See the menu page Analytical Methods for a rundown on where to go for information on Elliott wave analysis.
By Tim Bovee, Portland, Oregon, October 4, 2023
Disclaimer
Tim Bovee, Private Trader tracks the analysis and trades of a private trader for his own accounts. Nothing in this blog constitutes a recommendation to buy or sell stocks, options or any other financial instrument. The only purpose of this blog is to provide education and entertainment.
No trader is ever 100 percent successful in his or her trades. Trading in the stock and option markets is risky and uncertain. Each trader must make trading decisions for his or her own account, and take responsibility for the consequences.
License
All content on Tim Bovee, Private Trader by Timothy K. Bovee is licensed under a Creative Commons Attribution-ShareAlike 4.0 International License.
Based on a work at www.timbovee.com.

You must be logged in to post a comment.