3:30 p.m. New York time
Half an hour before the closing bell. The S&P 500 futures continued to rise during the session.
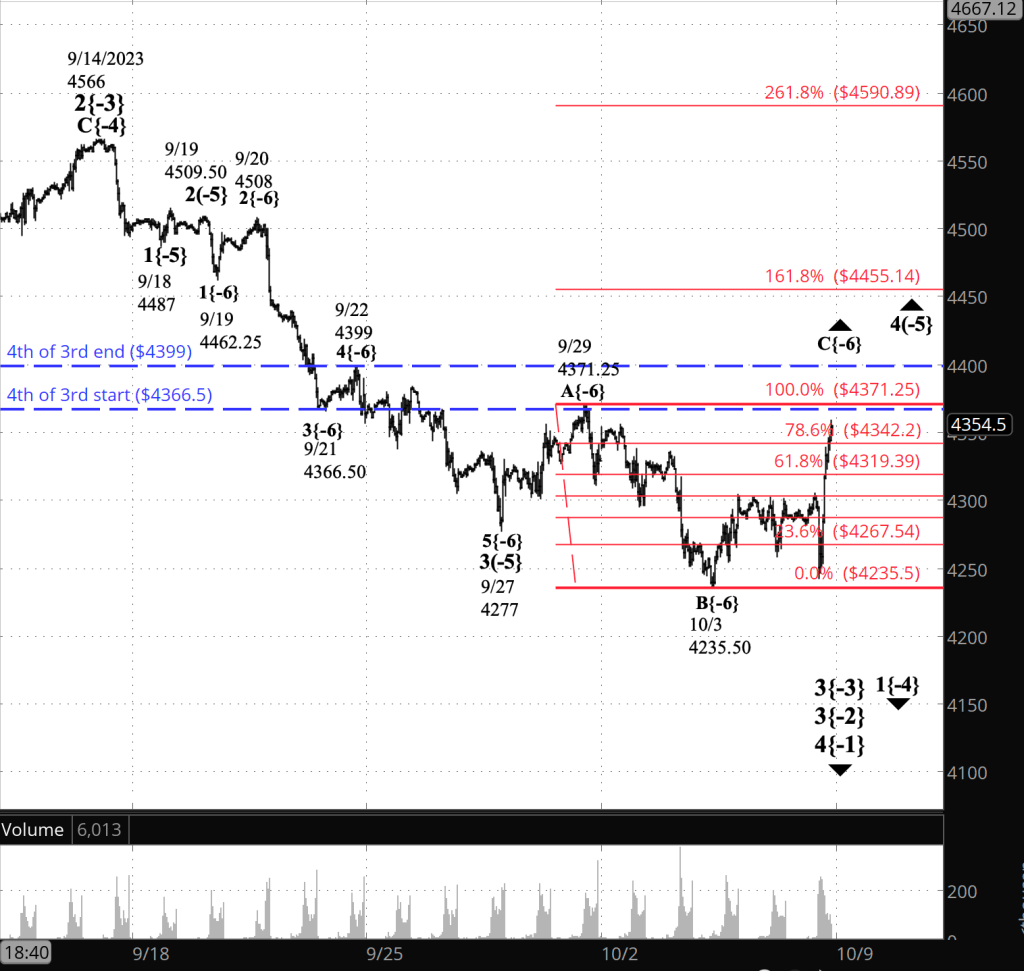
Within the 4th wave upward correction that began in late September, the C wave breezed past the 78.6% Fibonacci retracement of the preceding A wave and approached the 100% retracement level, the A wave’s starting point.
A 4th wave, typically, will end within the 4th subwave of the preceding 3rd wave of the same degree. In this case, that subwave began at 4366.50 and ended at 4399, providing a target range for the correction I’ve marked the boundary of that range with blue dashed lines.
Bottom line, in my opinion: The rising 3rd subwave within wave C is underway. It will be followed by a falling 4th subwave, and then a final rising 5th subwave that will end the correction, unless it takes a compound form, stringing together two or three corrective patterns.
9:35 a.m. New York time
What’s happening now? The S&P 500 E-mini futures traded narrowly overnight until the U.S. Employment Situation Report was released an hour before the opening bell, and then dropped 50 points within the span of a minute. In subsequent trading it dropped another 10 points and then recovered about a third of the decline.
What does it mean? Under the Principal Analysis, marked on the chart, the rapid fall counts as the 4th of five waves within the final subwave of a 4th-wave upward correction that began on September 27. Under the alternative analysis, the fall is part of a rising 2nd-wave correction within a 5th wave downtrend that began on September 29
What are the alternatives? The A wave on the chart is the 4th wave in its entirety. The size is disproportionate to prior waves of the same degree, but it’s still possible. If this proves to be the better analysis, then a 5th-wave downtrend began on September 29 and is still underway.
[S&P 500 E-mini futures at 9:35 a.m., 40-minute bars, with volume]
What does Elliott wave theory say? Here are the waves that underly the analyses.
Principal Analysis:
- A downtrend, wave 3{-2}, began on July 27 and is underway.
- Within wave 3{-2}, a smaller downtrend, wave 3{-3}, began on September 14 and is in its initial subwave, wave 1{-4}.
- With wave 1{-4}, subwave 4{-5}, an upward correction, is underway, having begun on September 27 from 4277.
- Wave 4{-5} is in its final subwave, rising wave C{-6}.
Alternative Analysis
- Downtrending wave 5{-5} is underway, having begun on September 29 from 4371.25, the date the preceding wave 4{-5} ended. Internally, it is presently in an upward correction, wave 2{-6}.
Big picture:
- The wave 3{-2} downtrend is a subwave of wave 4{-1}, a downtrend that began on January 4, 2022.
- Wave 4{-1}, in turn, is a subwave of wave 5{0}, an expanding Diagonal Triangle that began on December 26, 2018.
- Wave 4{-1} may eventually reach the lower boundary of wave 5{0}, presently slightly below 1800 and declining further each day.
- Wave 4{-1} will be followed by rising wave 5{-1}, the final wave in the Triangle.
We Are Here.
These are the waves currently in progress under my principal analysis. Each line on the list shows the wave number, with the subscript in curly brackets, the traditional degree name, the starting date, the starting price of the S&P 500 E-mini futures, and the direction of the wave.
- S&P 500 Index:
- 5{+3} Supercycle, 7/8/1932, 4.40 (up)
- 5{+2} Cycle, 12/9/1974, 60.96 (up)
- 5{+1} Primary, 3/6/2009, 666.79 (up)
- 5{0} Intermediate, 12/26/2018, 2346.58 (up)
- S&P 500 Futures and index:
- 4{-1} Minor, 1/4/2022, 4953.25 (down) (futures), 4818.62 (down) (index)
- S&P 500 Futures:
- 3{-2} Minute, 7/27/2023, 3502 (down)
Reading the chart. Price movements — waves – – in Elliott wave analysis are labeled with numbers within trending waves and letters with corrective waves. The subscripts — numbers in curly brackets — designate the wave’s degree, which, in Elliott wave analysis, means the relative position of a wave within the larger and smaller structures that make up the chart. R.N. Elliott, who in the 1930s developed the form of analysis that bears his name, viewed the chart as a complex structure of smaller waves nested within larger waves, which in turn are nested within still larger waves. In mathematics it’s called a fractal structure, where at every scale the pattern is similar to the others.
Learning and other resources. Elliott wave analysis provides context, not prophecy. As the 20th century semanticist Alfred Korzybski put it in his book Science and Sanity (1933), “The map is not the territory … The only usefulness of a map depends on similarity of structure between the empirical world and the map.” And I would add, in the ever-changing markets, we can judge that similarity of structure only after the fact.
See the menu page Analytical Methods for a rundown on where to go for information on Elliott wave analysis.
By Tim Bovee, Portland, Oregon, October 6, 2023
Disclaimer
Tim Bovee, Private Trader tracks the analysis and trades of a private trader for his own accounts. Nothing in this blog constitutes a recommendation to buy or sell stocks, options or any other financial instrument. The only purpose of this blog is to provide education and entertainment.
No trader is ever 100 percent successful in his or her trades. Trading in the stock and option markets is risky and uncertain. Each trader must make trading decisions for his or her own account, and take responsibility for the consequences.
License
All content on Tim Bovee, Private Trader by Timothy K. Bovee is licensed under a Creative Commons Attribution-ShareAlike 4.0 International License.
Based on a work at www.timbovee.com.

You must be logged in to post a comment.