3:30 p.m. New York time
Half an hour before the closing bell. The S&P 500 futures rose to a session high of 4414.25 and then pulled back, fluctuating around 4400 except for a brief foray into the 4380s. This morning’s analysis is unchanged. A low degree upward correction, wave 2{-10}, is either still underway or perhaps ended at the high. I’ve updated the chart.
9:35 a.m. New York time
What’s happening now? The S&P 500 E-mini futures fluctuated sideways from the 4350s and the 4370s after trading resumed overnight, reaching higher into the 4380s as the opening bell approached.
What does it mean? A 5th-wave downtrend began on October 12 and is now in the early stages of its 1st subwave.
What are the alternatives? There are two:
Alternative #1: The degree labels are lower than the reality on the chart. The degree {-8} waves, for example, ought to be labeled {-7} and the {-9} wave changed to {-8}.
Alternative #2: The final leg of the upward correction — wave C{-6} within wave 4{-5} — ended at the overnight high and the correction is taking a compound structure. Declining wave X{-6}, a connector wave, has begun and will be followed by a second corrective pattern.
The Chart. I’ve broadened the chart to show the entirety, so far, of the 5th-wave downward correction, wave 5{-5} on the chart. At this point the main we’ve I’m tracking to understand the market are of degree {-5} and degree {-4}
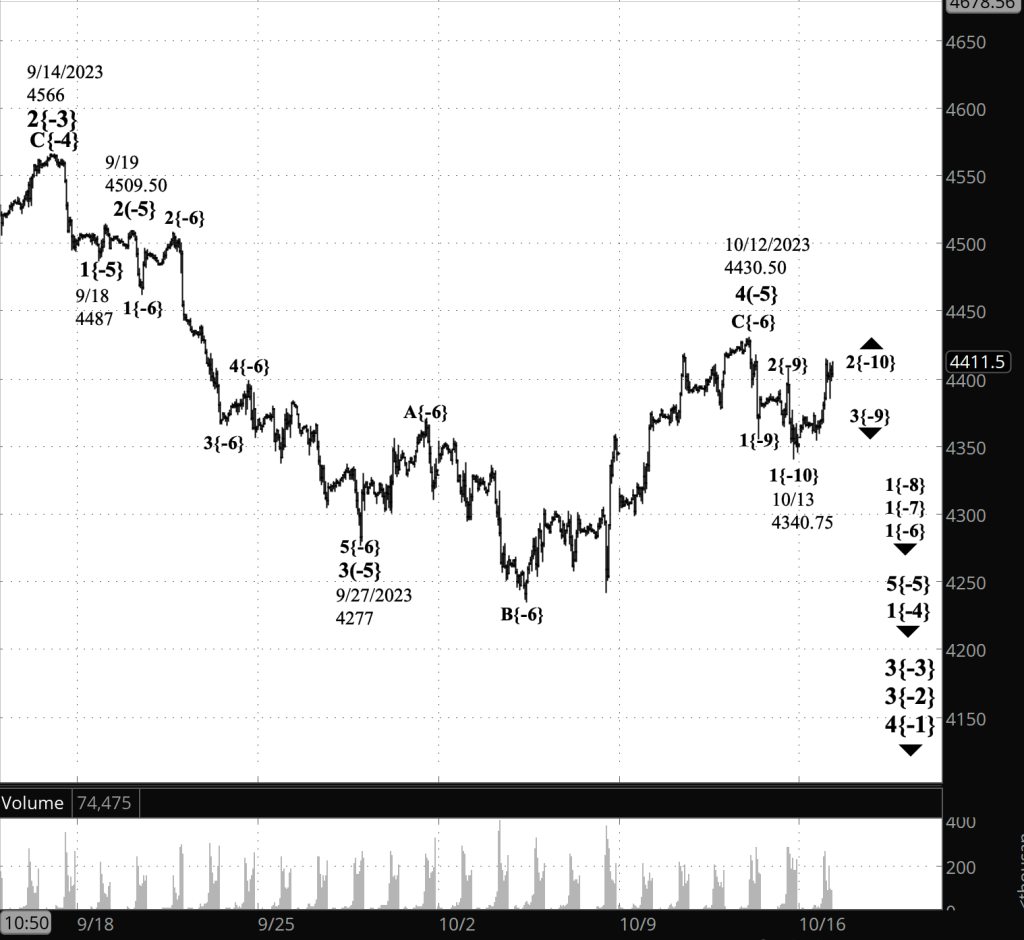
[S&P 500 E-mini futures at 3:30 p.m., 55-minute bars, with volume]
What does Elliott wave theory say? Here are the waves that underly the analyses.
Here are the waves that underly the analyses.
Principal Analysis:
- A downtrend, wave 3{-2}, began on July 27 and is underway.
- Within wave 3{-2}, a smaller downtrend, wave 3{-3}, began on September 14 and is in its initial subwave, wave 1{-4}.
- With wave 1{-4}, subwave 5{-5}, an downtrend, is underway, having begun on October 12.
- Wave 5{-5} is in its first subwave, wave 1{-6}.
Alternative Analysis #1: Degrees
- The low on October 13 was the end of wave 1{-9} within downtrending wave 3{-8}.
Alternative Analysis #2: Compound Correction
- An upward correction, wave 4{-5}, is underway and is forming a compound structure. The first corrective pattern ended on October 12, and a declining connector subwave, wave X{-4}, is underway.
Big picture:
- The wave 3{-2} downtrend is a subwave of wave 4{-1}, a downtrend that began on January 4, 2022.
- Wave 4{-1}, in turn, is a subwave of wave 5{0}, an expanding Diagonal Triangle that began on December 26, 2018.
- Wave 4{-1} may eventually reach the lower boundary of wave 5{0}, presently slightly below 1800 and declining further each day.
- Wave 4{-1} will be followed by rising wave 5{-1}, the final wave in the Triangle.
We Are Here.
These are the waves currently in progress under my principal analysis. Each line on the list shows the wave number, with the subscript in curly brackets, the traditional degree name, the starting date, the starting price of the S&P 500 E-mini futures, and the direction of the wave.
- S&P 500 Index:
- 5{+3} Supercycle, 7/8/1932, 4.40 (up)
- 5{+2} Cycle, 12/9/1974, 60.96 (up)
- 5{+1} Primary, 3/6/2009, 666.79 (up)
- 5{0} Intermediate, 12/26/2018, 2346.58 (up)
- S&P 500 Futures and index:
- 4{-1} Minor, 1/4/2022, 4953.25 (down) (futures), 4818.62 (down) (index)
- S&P 500 Futures:
- 3{-2} Minute, 7/27/2023, 3502 (down)
Reading the chart. Price movements — waves – – in Elliott wave analysis are labeled with numbers within trending waves and letters with corrective waves. The subscripts — numbers in curly brackets — designate the wave’s degree, which, in Elliott wave analysis, means the relative position of a wave within the larger and smaller structures that make up the chart. R.N. Elliott, who in the 1930s developed the form of analysis that bears his name, viewed the chart as a complex structure of smaller waves nested within larger waves, which in turn are nested within still larger waves. In mathematics it’s called a fractal structure, where at every scale the pattern is similar to the others.
Learning and other resources. Elliott wave analysis provides context, not prophecy. As the 20th century semanticist Alfred Korzybski put it in his book Science and Sanity (1933), “The map is not the territory … The only usefulness of a map depends on similarity of structure between the empirical world and the map.” And I would add, in the ever-changing markets, we can judge that similarity of structure only after the fact.
See the menu page Analytical Methods for a rundown on where to go for information on Elliott wave analysis.
By Tim Bovee, Portland, Oregon, October 16, 2023
Disclaimer
Tim Bovee, Private Trader tracks the analysis and trades of a private trader for his own accounts. Nothing in this blog constitutes a recommendation to buy or sell stocks, options or any other financial instrument. The only purpose of this blog is to provide education and entertainment.
No trader is ever 100 percent successful in his or her trades. Trading in the stock and option markets is risky and uncertain. Each trader must make trading decisions for his or her own account, and take responsibility for the consequences.
License
All content on Tim Bovee, Private Trader by Timothy K. Bovee is licensed under a Creative Commons Attribution-ShareAlike 4.0 International License.
Based on a work at www.timbovee.com.

You must be logged in to post a comment.