3:30 p.m. New York time
Half an hour before the closing bell. The S&P 500 futures fell throughout the session, reaching into the 4340s so far as the closing bell approached. This morning’s analysis is unchanged. I’ve updated the chart.
9:40 a.m. New York time
SPY options entry. I’ve posted the trade analyses of two bear call options spreads on SPY, entered October 17 with nine days remaining before expiration. Publication of the analyses was delayed by circumstances. After placing the first trade, I decided to double down and placed a second identical trade, so there are two analyses with different premiums: The first position and the second position.
9:35 a.m. New York time
What’s happening now? The S&P 500 E-mini futures fell during the session, from just below 4400 after yesterday’s closing bell to the 4370s as today’s opening bell approached.
What does it mean? The 3rd wave of a low-degree downtrend continues. The downtrend is a subwave within a series of nested first waves within a 5th wave downtrend began on October 12 that is four degrees larger.
Encompassing the whole structure is a 3rd wave downtrend, two degrees larger than the 5th, which began on September 14.
What are the alternatives? There are two:
Alternative #1: The degree labels are lower than the reality on the chart. The degree {-8} waves, for example, ought to be labeled {-7} and the {-9} wave changed to {-8}.
Alternative #2: The final leg of the upward correction — wave C{-6} within wave 4{-5} — ended at the overnight high and the correction is taking a compound structure. Declining wave X{-6}, a connector wave, has begun and will be followed by a second corrective pattern.
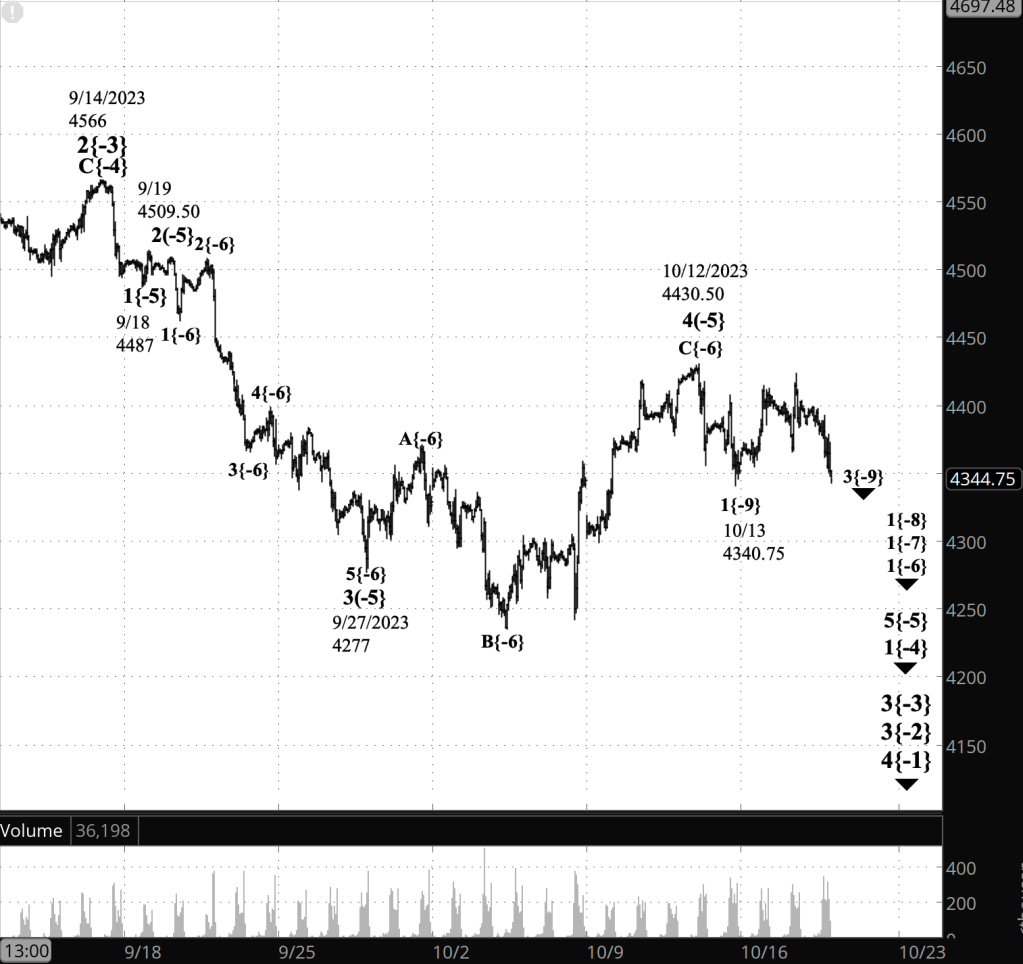
[S&P 500 E-mini futures at 3:30 p.m., hourly bars, with volume]
What does Elliott wave theory say? Here are the waves that underly the analyses.
Principal Analysis:
- A downtrend, wave 3{-2}, began on July 27 and is underway.
- Within wave 3{-2}, a smaller downtrend, wave 3{-3}, began on September 14 and is in its initial subwave, wave 1{-4}.
- With wave 1{-4}, subwave 5{-5}, an downtrend, is underway, having begun on October 12.
- Wave 5{-5} is in its first subwave, wave 1{-6}.
- Within wave 1{-6}, waves 1{-7}, 1{-8} and 3{-9} are underway
Alternative Analysis #1: Degrees
- The degrees in the principal analysis are lower than they will eventually turn out to be. The present downtrending wave 3{-9} is wave 3{-8} or perhaps even 3{-7}.
Alternative Analysis #2: Compound Correction
- An upward correction, wave 4{-5}, is underway and is forming a compound structure. The first corrective pattern ended on October 12, and a declining connector subwave, wave X{-4}, is underway.
We Are Here.
These are the waves currently in progress under my principal analysis. Each line on the list shows the wave number, with the subscript in curly brackets, the traditional degree name, the starting date, the starting price of the S&P 500 E-mini futures, and the direction of the wave.
- S&P 500 Index:
- 5{+3} Supercycle, 7/8/1932, 4.40 (up)
- 5{+2} Cycle, 12/9/1974, 60.96 (up)
- 5{+1} Primary, 3/6/2009, 666.79 (up)
- 5{0} Intermediate, 12/26/2018, 2346.58 (up)
- S&P 500 Futures and index:
- 4{-1} Minor, 1/4/2022, 4953.25 (down) (futures), 4818.62 (down) (index)
- S&P 500 Futures:
- 3{-2} Minute, 7/27/2023, 3502 (down)
Reading the chart. Price movements — waves – – in Elliott wave analysis are labeled with numbers within trending waves and letters with corrective waves. The subscripts — numbers in curly brackets — designate the wave’s degree, which, in Elliott wave analysis, means the relative position of a wave within the larger and smaller structures that make up the chart. R.N. Elliott, who in the 1930s developed the form of analysis that bears his name, viewed the chart as a complex structure of smaller waves nested within larger waves, which in turn are nested within still larger waves. In mathematics it’s called a fractal structure, where at every scale the pattern is similar to the others.
Learning and other resources. Elliott wave analysis provides context, not prophecy. As the 20th century semanticist Alfred Korzybski put it in his book Science and Sanity (1933), “The map is not the territory … The only usefulness of a map depends on similarity of structure between the empirical world and the map.” And I would add, in the ever-changing markets, we can judge that similarity of structure only after the fact.
See the menu page Analytical Methods for a rundown on where to go for information on Elliott wave analysis.
By Tim Bovee, Portland, Oregon, October 18, 2023
Disclaimer
Tim Bovee, Private Trader tracks the analysis and trades of a private trader for his own accounts. Nothing in this blog constitutes a recommendation to buy or sell stocks, options or any other financial instrument. The only purpose of this blog is to provide education and entertainment.
No trader is ever 100 percent successful in his or her trades. Trading in the stock and option markets is risky and uncertain. Each trader must make trading decisions for his or her own account, and take responsibility for the consequences.
License
All content on Tim Bovee, Private Trader by Timothy K. Bovee is licensed under a Creative Commons Attribution-ShareAlike 4.0 International License.
Based on a work at www.timbovee.com.

You must be logged in to post a comment.