3:30 p.m. New York time
Half an hour before the closing bell. The S&P 500 futures fell into the 4250s during the session. The 3rd wave downtrend that began on October 17 continued and is in its 5th and final wave.
When the 3rd wave is complete, an upward correction, a 4th wave, will begin.
This morning’s analysis is unchanged. I’ve updated the chart.
11:45 a.m. New York time
SPY 10DTE options position entered. I’ve continued my trade series aimed at understanding the value, or lack of value, of trading very short-term options. The goal is to get close to 8 days until expiration at entry. Each trade is chosen based on an Elliott Wave analysis of the underlying stock’s chart.
The first two attempts reached 50% of maximum potential profit, the first on the same day as entry, making it a day trade, and second on the second day after entry.
In this case — the third trade — I’ve entered bear call spread on SPY that expires in 10 days. The trade is meant to profit from a very low degree downtrend, wave 5{-10}, which began on October 17.
I’ve posted an analysis of the trade.
9:35 a.m. New York time
What’s happening now? The S&P 500 E-mini futures traded sideways overnight, staying between the 43-oughts and the 4280s.
What does it mean? The movement is an upward correction of relatively low degree within a 3rd-wave downtrend that began on October 17. The downtrend, wave 3{-9}, is four degrees lower than a larger downtrend, wave 5{-5}, which began on October 12 and has dominated the market for the past week. The 5th wave, in turn, a subwave two degrees lower than wave 3{-3}, which began on September 13 and which, if typical, will dominate the chart for the rest of the year.
Wave 3{-9} has moved below the startng point of the preceding 1st wave, eliminating the alternative scenario that had wave 2{-9} still underway and forming a compound correction.
What are the alternatives? The degree labels are lower than the reality on the chart. The degree {-8} waves, for example, ought to be labeled {-7} and the {-9} wave changed to {-8}.
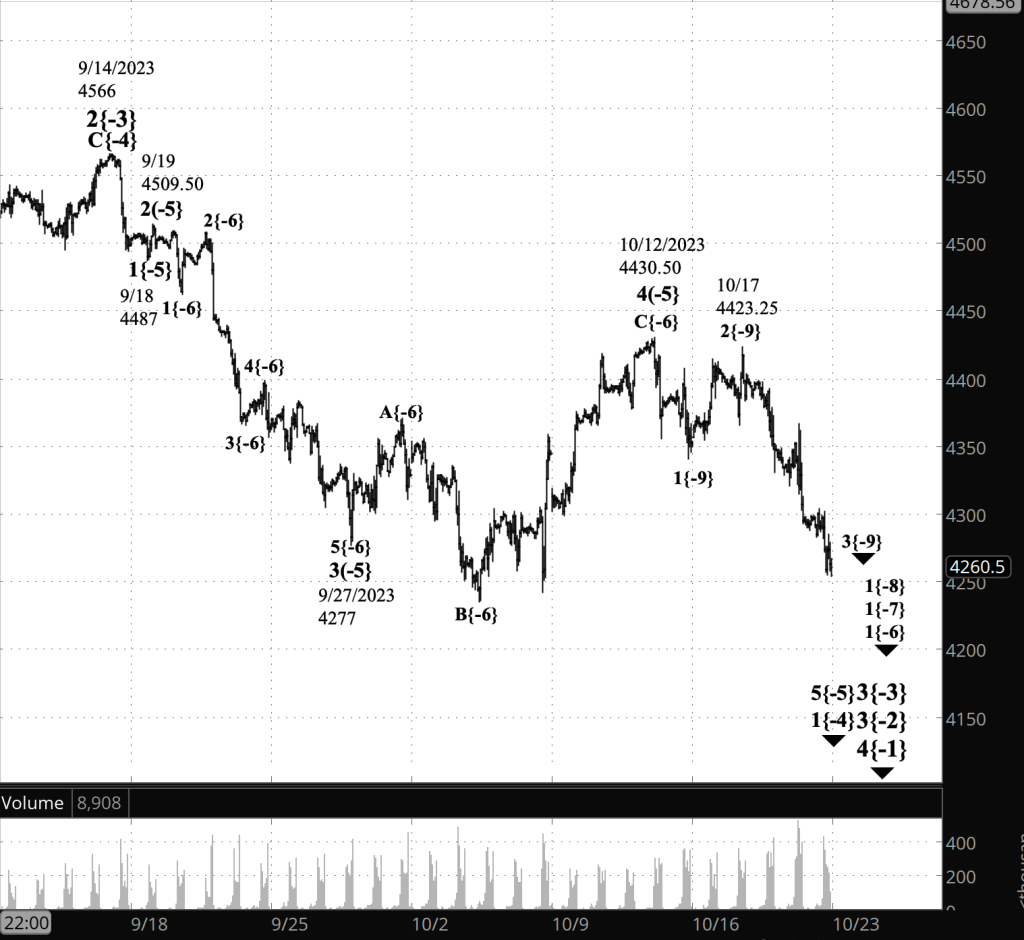
[S&P 500 E-mini futures at 3:30 p.m., 70-minute bars, with volume]
What does Elliott wave theory say? Here are the waves that underly the analyses.
Principal Analysis:
- A downtrend, wave 3{-2}, began on July 27 and is underway.
- Within wave 3{-2}, a smaller downtrend, wave 3{-3}, began on September 14 and is in its initial subwave, wave 1{-4}.
- With wave 1{-4}, subwave 5{-5}, an downtrend, is underway, having begun on October 12.
- Wave 5{-5} is in its first subwave, wave 1{-6}.
- Within wave 1{-6}, waves 1{-7} and 1{-8} are underway.
- Within 1{-8}, wave 3{-9} is underway and is in a wave 4{-10} upward correction.
Alternative Analysis
- The degrees in the principal analysis are lower than they will eventually turn out to be. The present downtrending wave 3{-9} is wave 3{-8} or perhaps even 3{-7}.
We Are Here.
These are the waves currently in progress under my principal analysis. Each line on the list shows the wave number, with the subscript in curly brackets, the traditional degree name, the starting date, the starting price of the S&P 500 E-mini futures, and the direction of the wave.
- S&P 500 Index:
- 5{+3} Supercycle, 7/8/1932, 4.40 (up)
- 5{+2} Cycle, 12/9/1974, 60.96 (up)
- 5{+1} Primary, 3/6/2009, 666.79 (up)
- 5{0} Intermediate, 12/26/2018, 2346.58 (up)
- S&P 500 Futures and index:
- 4{-1} Minor, 1/4/2022, 4953.25 (down) (futures), 4818.62 (down) (index)
- S&P 500 Futures:
- 3{-2} Minute, 7/27/2023, 3502 (down)
Reading the chart. Price movements — waves – – in Elliott wave analysis are labeled with numbers within trending waves and letters with corrective waves. The subscripts — numbers in curly brackets — designate the wave’s degree, which, in Elliott wave analysis, means the relative position of a wave within the larger and smaller structures that make up the chart. R.N. Elliott, who in the 1930s developed the form of analysis that bears his name, viewed the chart as a complex structure of smaller waves nested within larger waves, which in turn are nested within still larger waves. In mathematics it’s called a fractal structure, where at every scale the pattern is similar to the others.
Learning and other resources. Elliott wave analysis provides context, not prophecy. As the 20th century semanticist Alfred Korzybski put it in his book Science and Sanity (1933), “The map is not the territory … The only usefulness of a map depends on similarity of structure between the empirical world and the map.” And I would add, in the ever-changing markets, we can judge that similarity of structure only after the fact.
See the menu page Analytical Methods for a rundown on where to go for information on Elliott wave analysis.
By Tim Bovee, Portland, Oregon, October 20, 2023
Disclaimer
Tim Bovee, Private Trader tracks the analysis and trades of a private trader for his own accounts. Nothing in this blog constitutes a recommendation to buy or sell stocks, options or any other financial instrument. The only purpose of this blog is to provide education and entertainment.
No trader is ever 100 percent successful in his or her trades. Trading in the stock and option markets is risky and uncertain. Each trader must make trading decisions for his or her own account, and take responsibility for the consequences.
License
All content on Tim Bovee, Private Trader by Timothy K. Bovee is licensed under a Creative Commons Attribution-ShareAlike 4.0 International License.
Based on a work at www.timbovee.com.

You must be logged in to post a comment.