3:30 p.m. New York time
Half an hour before closing bell. The S&P 500 futures headed south for the first part of the session and then reversed to the upside.
Alternative Analysis #1 from this morning proved to be the more accurate of two possibilities with equal likelihoods.
As the closing bell approaches, traders are in the same position as this morning when reading the chart: The session low, 4146.25, may be the end of the B wave, the second of three waves within the 4th-wave upward correction that began on October 23, and the beginning of the C wave, the final wave in the correction, most likely. Or, of equal likelihood, the price might reverse and drop further, keeping the B wave alive a bit longer. See this morning’s analysis, below, for more on the subject.
I’ve updated the chart, moving the B-wave label to the session low and retaining as the principal analysis the scenario that sees the C wave as having begun.
9:35 a.m. New York time
What’s happening now? The S&P 500 E-mini futures fell overnight into the 4170s and then rapidly rose as the opening bell approached. The rise coincided with the release of the advance estimate of the GDP for the 3rd quarter.
What does it mean? As a principal analysis I’ve chosen to label the overnight low as the end of descending wave B within a 4th wave upward correction that began October 23 and as the beginning of rising wave C. It is equally likely that the price will reverse and move still lower, allow the B wave to decline further before reversing and beginning the C wave.
I chose the C-wave scenario based on the distance traveled below the starting point of the correction. The B wave within a 4th wave correction can move below the correction’s starting point without breaking any rules of Elliott Wave Theory. However, the break-below must be proportional with the rest of the waves within the correction. Subjectively, it seems to me that the present decline is proportional and further decline would risk destroying that proportionality.
Elliott Wave analysis is first and foremost based on the art of pattern recognition, something the human brain excels at. But at the end of the day, patterns are often ambiguous, and recognizing them is a subjective art.
In either case, once the C wave has begun, it is likely to approach the target range, from 4320.75 to 4366.50, the span covered by the 4th wave within the preceding 3rd wave of the same degree as the correction. That’s the typical behavior for a 4th wave upward correction. Not all 4th waves behave typically.
The C wave will complete the upward correction, unless the correction takes a compound form, stringing two or three corrective patterns together. However the chart plays out, the correction will be followed by a 5th wave downtrend that likely will carry the wave back below the correction’s starting point, 4213.25, and perhaps significantly below that level.
What are the alternatives?
Alternative #1: The B-wave continues. I discussed this alternative in the “What does it mean?” section as having equal likelihood with the principal analysis: Wave B will move lower before ending.
Alternative #2: Bigger and Smaller. Ascertaining the the size of the waves, their degrees within the fractal structure of the chart, is a difficult and often an impossible chore. Under this scenario, the degree labels on the chart are lower than the reality of the chart. For example, the degree {-8} waves on the chart ought to be labeled {-7} and the {-9} wave changed to {-8}.
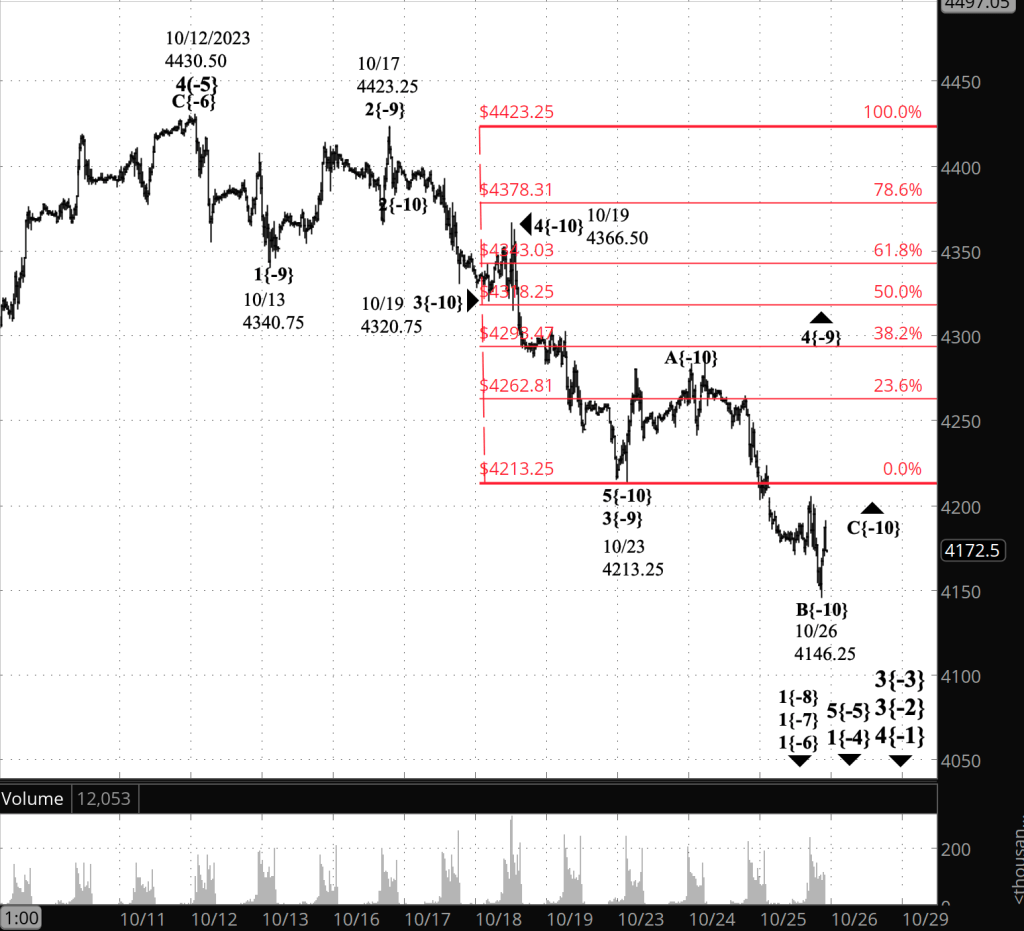
[S&P 500 E-mini futures at 3:30 p.m., 30-minute bars, with volume]
What does Elliott wave theory say? Here are the waves that underly the analyses.
Principal Analysis:
- A downtrend, wave 3{-2}, began on July 27 and is underway.
- Within wave 3{-2}, a smaller downtrend, wave 3{-3}, began on September 14 and is in its initial subwave, wave 1{-4}.
- With wave 1{-4}, subwave 5{-5}, an downtrend, is underway, having begun on October 12.
- Wave 5{-5} is in its first subwave, wave 1{-6}.
- Within wave 1{-6}, waves 1{-7} and 1{-8} are underway.
- Within 1{-8}, a downward correction ,wave 4{-9}, is underway and is in wave C{-10}, the last of three subwaves.
Alternative Analysis #1
- Within wave 4{-9}, wave B{-10}, the middle wave of three subwaves, is underway.
Alternative Analysis #2
- The degrees in the principal analysis are lower than they will eventually turn out to be. The present downtrending wave 3{-9} is wave 3{-8} or perhaps even 3{-7}.
We Are Here.
These are the waves currently in progress under my principal analysis. Each line on the list shows the wave number, with the subscript in curly brackets, the traditional degree name, the starting date, the starting price of the S&P 500 E-mini futures, and the direction of the wave.
- S&P 500 Index:
- 5{+3} Supercycle, 7/8/1932, 4.40 (up)
- 5{+2} Cycle, 12/9/1974, 60.96 (up)
- 5{+1} Primary, 3/6/2009, 666.79 (up)
- 5{0} Intermediate, 12/26/2018, 2346.58 (up)
- S&P 500 Futures and index:
- 4{-1} Minor, 1/4/2022, 4953.25 (down) (futures), 4818.62 (down) (index)
- S&P 500 Futures:
- 3{-2} Minute, 7/27/2023, 3502 (down)
Reading the chart. Price movements — waves – – in Elliott wave analysis are labeled with numbers within trending waves and letters with corrective waves. The subscripts — numbers in curly brackets — designate the wave’s degree, which, in Elliott wave analysis, means the relative position of a wave within the larger and smaller structures that make up the chart. R.N. Elliott, who in the 1930s developed the form of analysis that bears his name, viewed the chart as a complex structure of smaller waves nested within larger waves, which in turn are nested within still larger waves. In mathematics it’s called a fractal structure, where at every scale the pattern is similar to the others.
Learning and other resources. Elliott wave analysis provides context, not prophecy. As the 20th century semanticist Alfred Korzybski put it in his book Science and Sanity (1933), “The map is not the territory … The only usefulness of a map depends on similarity of structure between the empirical world and the map.” And I would add, in the ever-changing markets, we can judge that similarity of structure only after the fact.
See the menu page Analytical Methods for a rundown on where to go for information on Elliott wave analysis.
By Tim Bovee, Portland, Oregon, October 26, 2023
Disclaimer
Tim Bovee, Private Trader tracks the analysis and trades of a private trader for his own accounts. Nothing in this blog constitutes a recommendation to buy or sell stocks, options or any other financial instrument. The only purpose of this blog is to provide education and entertainment.
No trader is ever 100 percent successful in his or her trades. Trading in the stock and option markets is risky and uncertain. Each trader must make trading decisions for his or her own account, and take responsibility for the consequences.
License
All content on Tim Bovee, Private Trader by Timothy K. Bovee is licensed under a Creative Commons Attribution-ShareAlike 4.0 International License.
Based on a work at www.timbovee.com.

You must be logged in to post a comment.