3:30 p.m. New York time
Half an hour before the closing bell. The S&P 500 futures continued rising during the session, reaching the 4390s. The first leg of the 2nd wave upward correction that began in late October continues. I’ve updated the chart.
9:35 a.m. New York time
What’s happening now? The S&P 500 E-mini futures traded sideways during most of overnight trading, rising sharply when the Employment Situation report was published as the opening bell approached.
What does it mean? The rise carried the price up to the 4360s, to the 78.6% Fibonacci retracement level. It is the final major retracement level shorter than a 100% retracement.
The 2nd wave upward correction that began on October 27 continues and is nearing the end of its first subwave, an A wave. Within the A wave, the final subwave, a 5th wave, is underway.
Under the rules of Elliott Wave theory, the 2nd wave correction and its current subwave, the A wave, have an upper boundary: It cannot move beyond the start of the preceding wave 1, which is 4430.50 in this case.
When the 5th wave is complete, it’s parent A wave will also be complete and a declining B wave will begin.
The A wave has five subwaves and so the correction is taking the form of a Zigzag, within which the B wave has a lower limit in Elliott Wave Theory: It never falls below the start of the preceding A wave, 4122.25 in this case.
The B wave will have three subwaves.
What are the alternatives? There is one at present. The degree of the subwaves within the rise so far from October 27 are a bit up in the air. What we see is certainly part of the A wave — Wave A{-9} within wave 2{-8}. But are they of the {-10} degree, or something lower — subwaves within subwaves? It’s not yet clear on the chart.
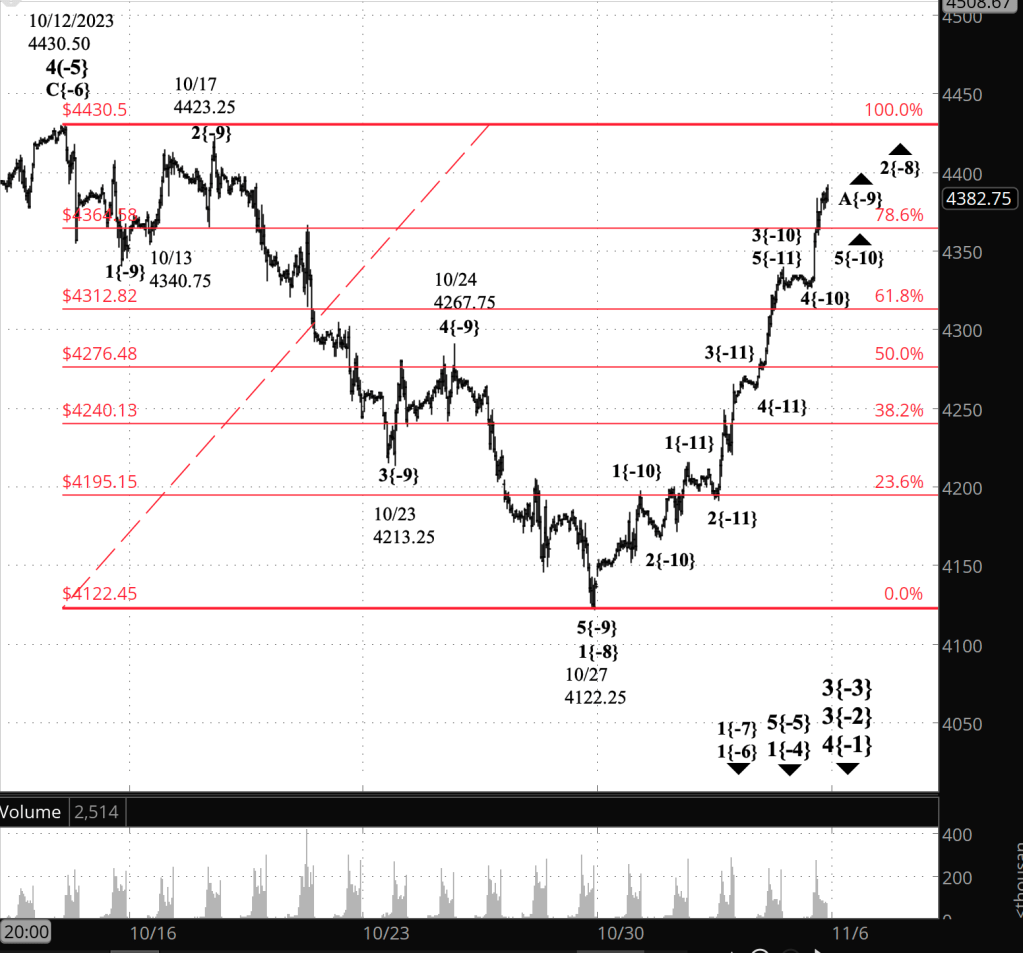
[S&P 500 E-mini futures at 3:30 p.m., 40-minute bars, with volume]
What does Elliott wave theory say? Here are the waves that underly the analyses.
Principal Analysis:
- A downtrend, wave 3{-2}, began on July 27 and is underway.
- Within wave 3{-2}, a smaller downtrend, wave 3{-3}, began on September 14 and is in its initial subwave, wave 1{-4}.
- With wave 1{-4}, subwave 5{-5}, an downtrend, is underway, having begun on October 12.
- Wave 5{-5} is in its first subwave, wave 1{-6}.
- Within waves 1{-6} and 1{-7} are underway.
- Wave 1{-7} is in its 2nd subwave, an upward correction, wave 2{-8}.
- Internally, wave 2{-8} is in its first subwave, rising wave A{-9}.
We Are Here.
These are the waves currently in progress under my principal analysis. Each line on the list shows the wave number, with the subscript in curly brackets, the traditional degree name, the starting date, the starting price of the S&P 500 E-mini futures, and the direction of the wave.
- S&P 500 Index:
- 5{+3} Supercycle, 7/8/1932, 4.40 (up)
- 5{+2} Cycle, 12/9/1974, 60.96 (up)
- 5{+1} Primary, 3/6/2009, 666.79 (up)
- 5{0} Intermediate, 12/26/2018, 2346.58 (up)
- S&P 500 Futures and index:
- 4{-1} Minor, 1/4/2022, 4953.25 (down) (futures), 4818.62 (down) (index)
- S&P 500 Futures:
- 3{-2} Minute, 7/27/2023, 3502 (down)
Reading the chart. Price movements — waves – – in Elliott wave analysis are labeled with numbers within trending waves and letters with corrective waves. The subscripts — numbers in curly brackets — designate the wave’s degree, which, in Elliott wave analysis, means the relative position of a wave within the larger and smaller structures that make up the chart. R.N. Elliott, who in the 1930s developed the form of analysis that bears his name, viewed the chart as a complex structure of smaller waves nested within larger waves, which in turn are nested within still larger waves. In mathematics it’s called a fractal structure, where at every scale the pattern is similar to the others.
Learning and other resources. Elliott wave analysis provides context, not prophecy. As the 20th century semanticist Alfred Korzybski put it in his book Science and Sanity (1933), “The map is not the territory … The only usefulness of a map depends on similarity of structure between the empirical world and the map.” And I would add, in the ever-changing markets, we can judge that similarity of structure only after the fact.
See the menu page Analytical Methods for a rundown on where to go for information on Elliott wave analysis.
By Tim Bovee, Portland, Oregon, November 3, 2023
Disclaimer
Tim Bovee, Private Trader tracks the analysis and trades of a private trader for his own accounts. Nothing in this blog constitutes a recommendation to buy or sell stocks, options or any other financial instrument. The only purpose of this blog is to provide education and entertainment.
No trader is ever 100 percent successful in his or her trades. Trading in the stock and option markets is risky and uncertain. Each trader must make trading decisions for his or her own account, and take responsibility for the consequences.
License
All content on Tim Bovee, Private Trader by Timothy K. Bovee is licensed under a Creative Commons Attribution-ShareAlike 4.0 International License.
Based on a work at www.timbovee.com.

You must be logged in to post a comment.