3:30 p.m. New York time
Half an hour before the closing bell. The S&P 500 futures dropped during the session into the 4360s and then returned to the 4380s. The first subwave within the 2nd wave upward correction continues. I’ve updated the chart.
3:10 p.m. New York time
Trades report. I’ve posted a trade analysis for today’s trades. I entered positions on IWM (4 days to expiration) and QQQ (1DTE).
A new approach. I’m bringing my new options trading plan into play beginning today and have posted a description of how it works, titled “A New Approach to Options Trading“.
I’ve had wise mentors from time to time praise the “trade small, trade often” approach. I’ve always found the trade often part of the advice to be difficult to follow. Sometimes, perhaps most of the time, there just aren’t that many good trades available, at least not trades that I would care to risk my hard-earned trading funds on.
The changes in approach that I’m making today are in part an attempt to make it possible, and profitable, to trade more often.
9:35 a.m. New York time
What’s happening now? The S&P 500 E-mini futures rose gently after trading resumed overnight, working its way from the 4370s to the 4380s.
What does it mean? The initial subwave of the 2nd wave upward correction that began on October 27 is nearing its end. That final subwave is an A wave, the first of three subwaves that make up most corrective patterns identified by Elliott Wave Theory.
Wave A will be followed by a declining B wave. What can we expect from it?
First, wave 2, which is the parent wave, is taking the form of a Zigzag, with five subwaves within the A subwave. In a Zigzag, the B wave never moves below the starting point of the wave A, which was 4122.25 in this case. That sets a lower boundary.
Typically within a Zigzag, a B wave will retrace somewhere from 38% to 79% of wave A. That’s quite a large window.
This tells us a couple of things.
First, If we take the present wave A high, 4391.75, as its end point (it may not be, this is just a hypothetical), then the typical B-wave endpoint would be between 4289 and 4179. It’s not a huge decline, but there’s money to be made, even at the shallow end of the retracement range.
Second, the B wave is unlikely to reach its lower boundary, 4122.25.
What are the alternatives? There is one, unchanged from Friday. The degree of the subwaves within the rise so far from October 27 are a bit up in the air. What we see is certainly part of the A wave — Wave A{-9} within wave 2{-8}. But are they of the {-10} degree, or something lower — subwaves within subwaves? It’s not yet clear on the chart.
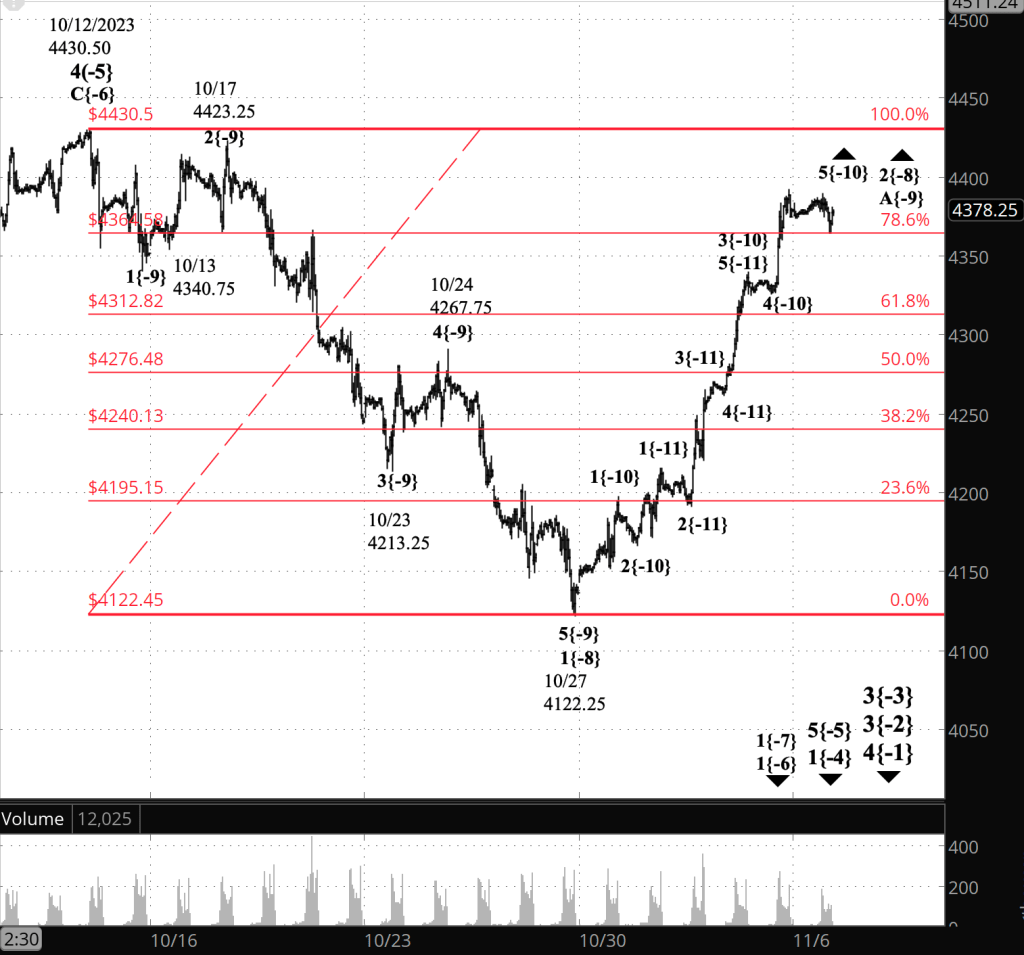
[S&P 500 E-mini futures at 3:30 p.m., 45-minute bars, with volume]
What does Elliott wave theory say? Here are the waves that underly the analyses.
Principal Analysis:
- A downtrend, wave 3{-2}, began on July 27 and is underway.
- Within wave 3{-2}, a smaller downtrend, wave 3{-3}, began on September 14 and is in its initial subwave, wave 1{-4}.
- With wave 1{-4}, subwave 5{-5}, an downtrend, is underway, having begun on October 12.
- Wave 5{-5} is in its first subwave, wave 1{-6}.
- Within waves 1{-6} and 1{-7} are underway.
- Wave 1{-7} is in its 2nd subwave, an upward correction, wave 2{-8}.
- Internally, wave 2{-8} is in its first subwave, rising wave A{-9}.
- Wave A{-9} is in its final subwave, wave 5{-10}, which perhaps has already ended.
We Are Here.
These are the waves currently in progress under my principal analysis. Each line on the list shows the wave number, with the subscript in curly brackets, the traditional degree name, the starting date, the starting price of the S&P 500 E-mini futures, and the direction of the wave.
- S&P 500 Index:
- 5{+3} Supercycle, 7/8/1932, 4.40 (up)
- 5{+2} Cycle, 12/9/1974, 60.96 (up)
- 5{+1} Primary, 3/6/2009, 666.79 (up)
- 5{0} Intermediate, 12/26/2018, 2346.58 (up)
- S&P 500 Futures and index:
- 4{-1} Minor, 1/4/2022, 4953.25 (down) (futures), 4818.62 (down) (index)
- S&P 500 Futures:
- 3{-2} Minute, 7/27/2023, 3502 (down)
Reading the chart. Price movements — waves – – in Elliott wave analysis are labeled with numbers within trending waves and letters with corrective waves. The subscripts — numbers in curly brackets — designate the wave’s degree, which, in Elliott wave analysis, means the relative position of a wave within the larger and smaller structures that make up the chart. R.N. Elliott, who in the 1930s developed the form of analysis that bears his name, viewed the chart as a complex structure of smaller waves nested within larger waves, which in turn are nested within still larger waves. In mathematics it’s called a fractal structure, where at every scale the pattern is similar to the others.
Learning and other resources. Elliott wave analysis provides context, not prophecy. As the 20th century semanticist Alfred Korzybski put it in his book Science and Sanity (1933), “The map is not the territory … The only usefulness of a map depends on similarity of structure between the empirical world and the map.” And I would add, in the ever-changing markets, we can judge that similarity of structure only after the fact.
See the menu page Analytical Methods for a rundown on where to go for information on Elliott wave analysis.
By Tim Bovee, Portland, Oregon, November 6, 2023
Disclaimer
Tim Bovee, Private Trader tracks the analysis and trades of a private trader for his own accounts. Nothing in this blog constitutes a recommendation to buy or sell stocks, options or any other financial instrument. The only purpose of this blog is to provide education and entertainment.
No trader is ever 100 percent successful in his or her trades. Trading in the stock and option markets is risky and uncertain. Each trader must make trading decisions for his or her own account, and take responsibility for the consequences.
License
All content on Tim Bovee, Private Trader by Timothy K. Bovee is licensed under a Creative Commons Attribution-ShareAlike 4.0 International License.
Based on a work at www.timbovee.com.

You must be logged in to post a comment.