3:30 p.m. New York time
Half an hour before the closing bell. The S&P 500 futures rose above the overnight high during the session, reaching 4402.50.
The move resolved this morning’s choice between two scenarios in favor of wave A being underway, and wave B still lying in the future. This dilemma involves subwaves of the 2nd wave upward correction that began on October 27.
Nonetheless, the price is still near a peak, and any higher high triggers the same question: Is wave A over and wave B begun, or is wave A still underway.
A B wave typically retraces 38% to 79% of the preceding A wave. Based on the session high, the typical B wave would fall to between 4343.75 and 4228.75.
I’ve updated the chart, showing the A wave as still underway.
3:05 p.m. New York time
Today’s trade. I’ve entered a short iron fly position on SPY that expires tomorrow and have posted a trade analysis.
11:55 a.m. New York time
11/6 Trades Results. I’ve exited my positions on IWM and QQQ, and have updated the trade analyses with results.
9:35 a.m. New York time
What’s happening now? The S&P 500 E-mini futures traded narrowly overnight, largely sticking to the region of the 78.6% Fibonacci retracement level. (The Fibonacci ladder is shown on the chart in red.)
What does it mean? The 2nd wave upward correction that began on October 27 continues. There are two possibilities of equal likelihood interpreting how far it has traveled in its three-subwave journey.
By one interpretation, the 1st subwave of the correction, the A wave, was completed by the November 3 high, 4391.75. That is the interpretation I’ve chosen for the chart. By the other interpretation, there is more upside left in the A wave and the shallow decline that followed the November 3 peak is just a pause to gather energy for a final upward push.
Elliott Wave Theory says that a 2nd wave can’t move beyond the starting point of the preceding 1st wave — 4430.50 in this case. If the A wave is in fact not yet complete, a final push upward can only have about 62 points remaining above the October 3 peak.
Under the scenario I chose for the chart, the second subwave of the correction, declining wave B, is now underway. The 2nd wave correction is taking the form of a Zigzag — Five subwaves in the A wave, three in the B and five in the C.
The B wave within a Zigzag typically retraces between 38% and 79% of the preceding A wave. As I calculated the Monday, November 6 post, that suggests the end point of wave B will be between 4289 and 4179.
What are the alternatives? There is one alternative. It has been with us for awhile and likely will stick around a while longer.
The alternative scenario is this: The degree of the subwaves within the rise so far from October 27 are a bit up in the air. What we see is certainly part of wave 2{-8}. But is it really of the {-8} degree, or something lower or higher? It’s not yet clear on the chart. If the degree differs from what I have on the chart, then the subwaves would also be adjusted accordingly.
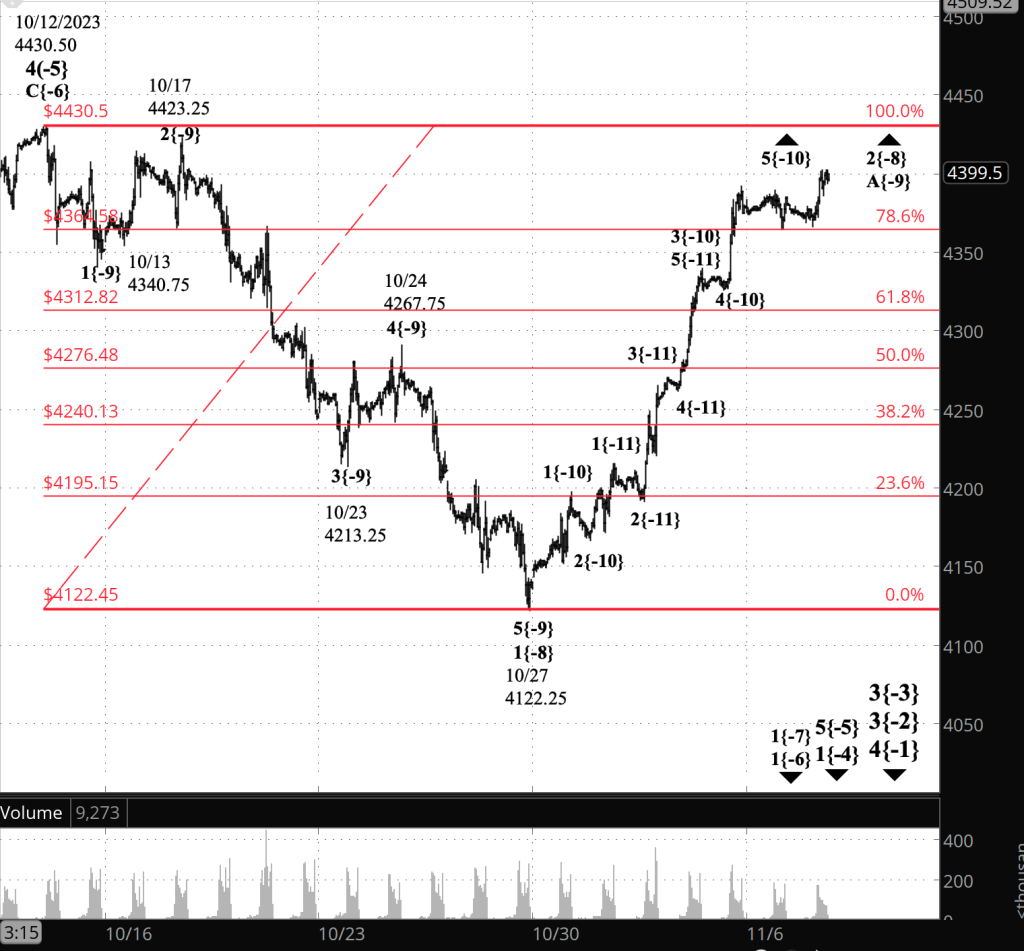
[S&P 500 E-mini futures at 3:30.m., 45-minute bars, with volume]
What does Elliott wave theory say? Here are the waves that underly the analyses.
Principal Analysis:
- A downtrend, wave 3{-2}, began on July 27 and is underway.
- Within wave 3{-2}, a smaller downtrend, wave 3{-3}, began on September 14 and is in its initial subwave, wave 1{-4}.
- With wave 1{-4}, subwave 5{-5}, an downtrend, is underway, having begun on October 12.
- Wave 5{-5} is in its first subwave, wave 1{-6}.
- Within waves 1{-6} and 1{-7} are underway.
- Wave 1{-7} is in its 2nd subwave, an upward correction, wave 2{-8}.
- Internally, wave 2{-8} is in its first subwave, rising wave A{-9}.
- Within wave 2{-8} I see two possibilities of equal likelihood:
- Wave A{-9} ended on November 3 at 4391.75 and wave B{-9} began
- Wave A{-9} continues and is its 5th and final subwave.
Alternative Analysis
- The upward correction, wave 2{-8}, is actually a higher degree or a lower degree than is shown on the chart.
We Are Here.
These are the waves currently in progress under my principal analysis. Each line on the list shows the wave number, with the subscript in curly brackets, the traditional degree name, the starting date, the starting price of the S&P 500 E-mini futures, and the direction of the wave.
- S&P 500 Index:
- 5{+3} Supercycle, 7/8/1932, 4.40 (up)
- 5{+2} Cycle, 12/9/1974, 60.96 (up)
- 5{+1} Primary, 3/6/2009, 666.79 (up)
- 5{0} Intermediate, 12/26/2018, 2346.58 (up)
- S&P 500 Futures and index:
- 4{-1} Minor, 1/4/2022, 4953.25 (down) (futures), 4818.62 (down) (index)
- S&P 500 Futures:
- 3{-2} Minute, 7/27/2023, 3502 (down)
Reading the chart. Price movements — waves – – in Elliott wave analysis are labeled with numbers within trending waves and letters with corrective waves. The subscripts — numbers in curly brackets — designate the wave’s degree, which, in Elliott wave analysis, means the relative position of a wave within the larger and smaller structures that make up the chart. R.N. Elliott, who in the 1930s developed the form of analysis that bears his name, viewed the chart as a complex structure of smaller waves nested within larger waves, which in turn are nested within still larger waves. In mathematics it’s called a fractal structure, where at every scale the pattern is similar to the others.
Learning and other resources. Elliott wave analysis provides context, not prophecy. As the 20th century semanticist Alfred Korzybski put it in his book Science and Sanity (1933), “The map is not the territory … The only usefulness of a map depends on similarity of structure between the empirical world and the map.” And I would add, in the ever-changing markets, we can judge that similarity of structure only after the fact.
See the menu page Analytical Methods for a rundown on where to go for information on Elliott wave analysis.
By Tim Bovee, Portland, Oregon, November 7, 2023
Disclaimer
Tim Bovee, Private Trader tracks the analysis and trades of a private trader for his own accounts. Nothing in this blog constitutes a recommendation to buy or sell stocks, options or any other financial instrument. The only purpose of this blog is to provide education and entertainment.
No trader is ever 100 percent successful in his or her trades. Trading in the stock and option markets is risky and uncertain. Each trader must make trading decisions for his or her own account, and take responsibility for the consequences.
License
All content on Tim Bovee, Private Trader by Timothy K. Bovee is licensed under a Creative Commons Attribution-ShareAlike 4.0 International License.
Based on a work at www.timbovee.com.

You must be logged in to post a comment.