3:30 p.m. New York time
Half an hour before the market close. The S&P 500 futures fell to the 4370s during the session and then rose, remaining below the 2nd wave upward correction’s peak so far of 4407.75. This morning’s principal analysis continues with it’s uncertainty: Either the 4407.75 peak is a stopping point in the ongoing late stage of the initial subwave, the rising A wave, within the correction, or the correction ended at the peak and the falling B wave is underway.
I’ve updated the chart.
2:40 p.m. New York time
Entered SPY short Iron Fly, IWM short Bear Call Spread. I’ve entered two options positions today, one on IWM, at 9 days to expiration (DTE), and the other on SPY, at 1DTE, and have posted analyses of the trades.
11:05 a.m. New York time
Exited SPY short Iron Fly. I’ve exited the short Iron Fly options position on SPY, entered yesterday, and have updated the November 7 trades analysis with full results.
9:35 a.m. New York time
What’s happening now? The S&P 500 E-mini futures traded sideways overnight, rising above 4405 at the opening bell.
What does it mean? The first subwave, wave A, of the 2nd-wave upward correction that began on October 27 continues trying to find its endpoint. The price has moved decisively above a major Fibonacci turning point, a 78.6% retracement, and has come within 30 points of the start of the preceding 1st wave, 4430.50.
Under the rules of Elliott Wave Analysis, no 2nd wave can move above the 1st wave starting point.
All of that means that wave A within wave 2 is almost complete, according to one of two equally likely scenarios. Under the other scenario, wave A ended at yesterday’s peak.
Whenever wave A ends, it will be followed by a downtrending B wave, and then a C wave that will push up to complete the 2nd wave. An energetic 3rd wave downtrend will following, carrying the below the start of the 2nd wave correction, 4122.25, and likely a significant distance below that level.
On the chart, I’ve chosen to use the scenario that has wave A still underway.
What are the alternatives? There is one, unchanged from the past few days. The alternative scenario is this: The degree of the subwaves within the rise so far from October 27 are a bit up in the air. What we see is certainly part of wave 2{-8}. But is it really of the {-8} degree, or something lower or higher? It’s not yet clear on the chart. If the degree differs from what I have on the chart, then the subwaves would also be adjusted accordingly.
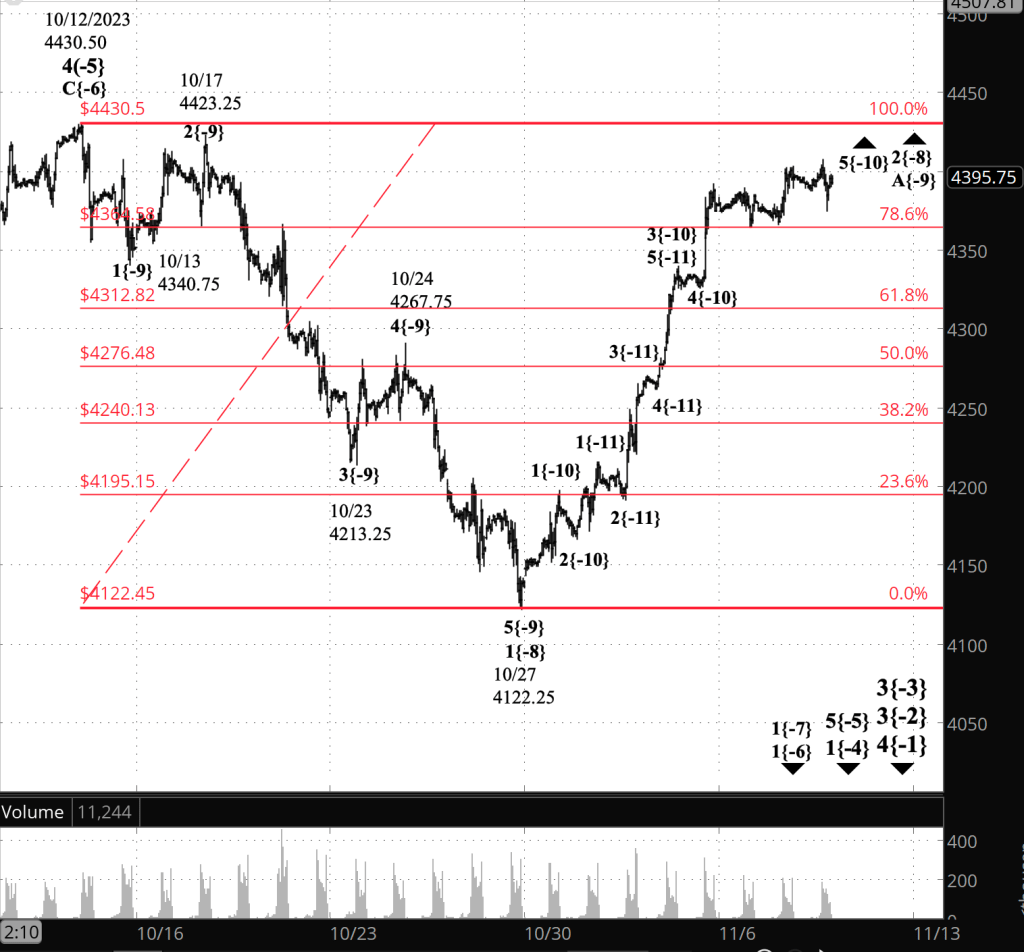
[S&P 500 E-mini futures at 3:30 p.m., 50-minute bars, with volume]
What does Elliott wave theory say? Here are the waves that underly the analyses.
Principal Analysis:
- A downtrend, wave 3{-2}, began on July 27 and is underway.
- Within wave 3{-2}, a smaller downtrend, wave 3{-3}, began on September 14 and is in its initial subwave, wave 1{-4}.
- With wave 1{-4}, subwave 5{-5}, an downtrend, is underway, having begun on October 12.
- Wave 5{-5} is in its first subwave, wave 1{-6}.
- Within waves 1{-6} and 1{-7} are underway.
- Wave 1{-7} is in its 2nd subwave, an upward correction, wave 2{-8}.
- Internally, wave 2{-8} is in its first subwave, rising wave A{-9}.
- Within wave 2{-8} I see two possibilities of equal likelihood:
- Wave A{-9} continues and is its 5th and final subwave.
- Wave A{-9} ended on November 7 at 4403.25 and wave B{-9} began.
Alternative Analysis
- The upward correction, wave 2{-8}, is a higher degree or a lower degree than is shown on the chart.
We Are Here.
These are the waves currently in progress under my principal analysis. Each line on the list shows the wave number, with the subscript in curly brackets, the traditional degree name, the starting date, the starting price of the S&P 500 E-mini futures, and the direction of the wave.
- S&P 500 Index:
- 5{+3} Supercycle, 7/8/1932, 4.40 (up)
- 5{+2} Cycle, 12/9/1974, 60.96 (up)
- 5{+1} Primary, 3/6/2009, 666.79 (up)
- 5{0} Intermediate, 12/26/2018, 2346.58 (up)
- S&P 500 Futures and index:
- 4{-1} Minor, 1/4/2022, 4953.25 (down) (futures), 4818.62 (down) (index)
- S&P 500 Futures:
- 3{-2} Minute, 7/27/2023, 3502 (down)
Reading the chart. Price movements — waves – – in Elliott wave analysis are labeled with numbers within trending waves and letters with corrective waves. The subscripts — numbers in curly brackets — designate the wave’s degree, which, in Elliott wave analysis, means the relative position of a wave within the larger and smaller structures that make up the chart. R.N. Elliott, who in the 1930s developed the form of analysis that bears his name, viewed the chart as a complex structure of smaller waves nested within larger waves, which in turn are nested within still larger waves. In mathematics it’s called a fractal structure, where at every scale the pattern is similar to the others.
Learning and other resources. Elliott wave analysis provides context, not prophecy. As the 20th century semanticist Alfred Korzybski put it in his book Science and Sanity (1933), “The map is not the territory … The only usefulness of a map depends on similarity of structure between the empirical world and the map.” And I would add, in the ever-changing markets, we can judge that similarity of structure only after the fact.
See the menu page Analytical Methods for a rundown on where to go for information on Elliott wave analysis.
By Tim Bovee, Portland, Oregon, November 8, 2023
Disclaimer
Tim Bovee, Private Trader tracks the analysis and trades of a private trader for his own accounts. Nothing in this blog constitutes a recommendation to buy or sell stocks, options or any other financial instrument. The only purpose of this blog is to provide education and entertainment.
No trader is ever 100 percent successful in his or her trades. Trading in the stock and option markets is risky and uncertain. Each trader must make trading decisions for his or her own account, and take responsibility for the consequences.
License
All content on Tim Bovee, Private Trader by Timothy K. Bovee is licensed under a Creative Commons Attribution-ShareAlike 4.0 International License.
Based on a work at www.timbovee.com.

You must be logged in to post a comment.