3:30 p.m. New York time
Half an hour before the closing bell. The S&P 500 futures gently rose to the 78.6% Fibonacci retracement level during the session, following a dramatic pre-opening rise coinciding withe release of inflation figures for October. The session high, and indeed the high for the entire first subwave of the wave 4 upward correction that has been with us since October 27, is in the 4520s, about 30 points away from the firm upper limit required by Elliott Wave Analysis, 4553.70.
If it happens that the price does move above that upper limit, then the old analysis is tossed and a new one put in its place. The alternative analysis, should it become necessary, would raise up the degrees in relation to the January 4, 2022 high, at 4963.50.
I’ve updated the chart.
9:35 a.m. New York time
What’s happening now? The S&P 500 E-mini futures traded sideways overnight until new inflation numbers were published an hour before the opening bell, and then pushed higher by 50 points within the span of a single minute, eventually reaching into the 4490s.
What does it mean? The rise was the first significant move above the 61.8% Fibonacci retracement level as the first subwave of a 4th wave upward correction navigates its end game. The Fibonacci ladder is shown on the chart in red, and I’ve moved the chart in to focus on the rise that began on October 27.
That subwave, wave A, has been fishing for a top since yesterday, and with this rise may well have found the peak. Or perhaps not. Under the rules of Elliott Wave Analysis, a 4th wave never moves beyond the end of the preceding 1st wave. In this case, that sets an upper limit of 4553.75.
But the power of this correction has been unusual. Fourth waves have a tendency to end within the range of the 4th subwave of the preceding 3rd wave. In this case, that would put the endpoint somewhere between 4235.50 and 4430.50. And that’s on the A wave. Normally, it is the final wave of a corrective pattern, the C wave that carries the price to a new high within a 4th-wave correction. And 4th waves tend to take the form of a Flat, with three subwaves within the A wave. This A wave has five subwaves and so is taking the form of a Zigzag.
The A wave has either almost ended or is already complete. In either case, it will be followed by a declining B wave that will have three subwaves and won’t move below the start of wave A, 4122.25, and then by a rising wave C that is likely about the same length as the preceding wave A and almost always will carry the price above the end of wave A
What are the alternatives? Just the one discussed above: Is wave A finished or not? I give it equal odds either way.
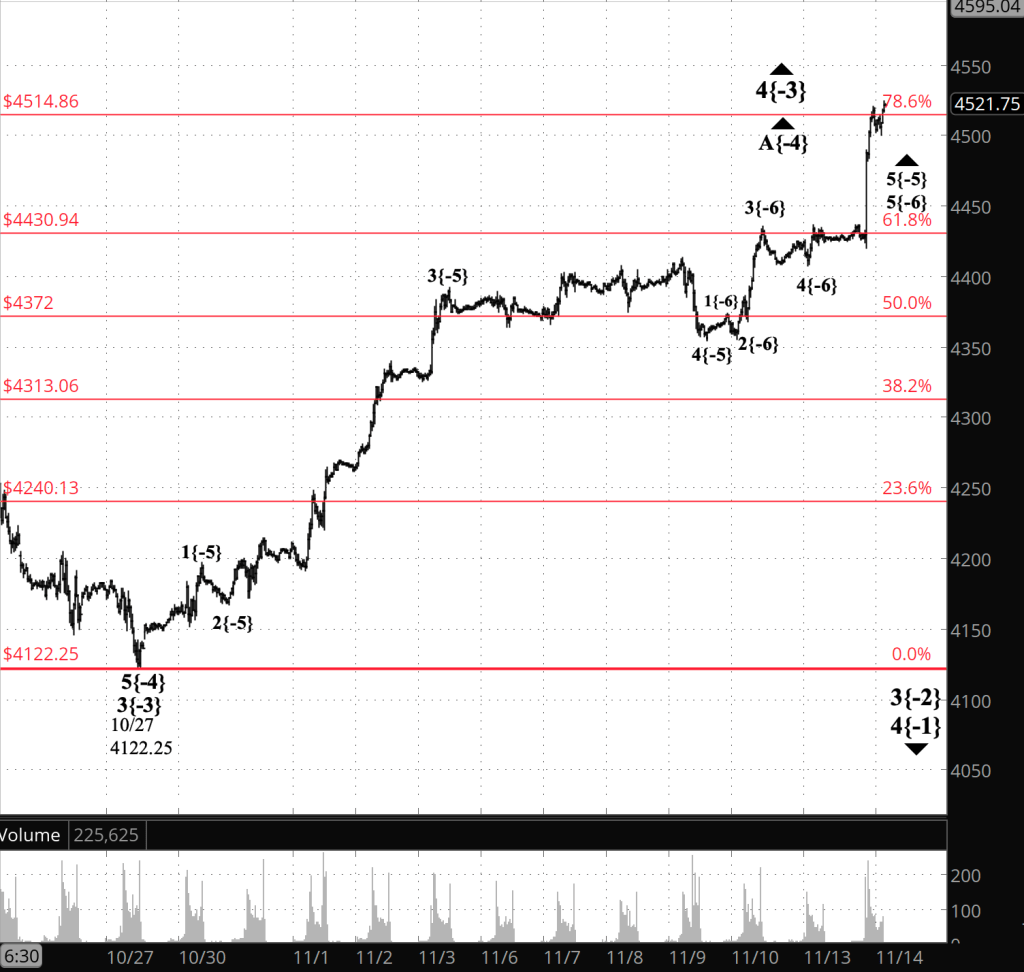
[S&P 500 E-mini futures at 3:30 p.m., 30-minute bars, with volume]
What does Elliott wave theory say? Here are the waves that underly the analyses.
Principal Analysis:
- A downtrend, wave 3{-2}, began on July 27 and is underway.
- Within wave 3{-2}, an upward correction, wave 4{-3}, began on October 27.
- Wave 4{-3} internally has two possibilities, each of equal likelihood:
- Scenario 1: Either rising wave A{-4} continues and is nearing it’s end.
- Scenario 2: Or wave A{-4} ended on November 10 at 4425.75 and wave B{-4} began from that point.
- Under the first scenario, wave A{-4} is its final subwave, wave 5{-5}, which in turn is in its final subwave, wave 5{-6}.
- Under the second scenario, declining wave B{-4} has begun and is in its initial subwave, wave A{-5}.
We Are Here.
These are the waves currently in progress under my principal analysis. Each line on the list shows the wave number, with the subscript in curly brackets, the traditional degree name, the starting date, the starting price of the S&P 500 E-mini futures, and the direction of the wave.
- S&P 500 Index:
- 5{+3} Supercycle, 7/8/1932, 4.40 (up)
- 5{+2} Cycle, 12/9/1974, 60.96 (up)
- 5{+1} Primary, 3/6/2009, 666.79 (up)
- 5{0} Intermediate, 12/26/2018, 2346.58 (up)
- S&P 500 Futures and index:
- 4{-1} Minor, 1/4/2022, 4953.25 (down) (futures), 4818.62 (down) (index)
- S&P 500 Futures:
- 3{-2} Minute, 7/27/2023, 3502 (down)
- 4{-3} Minuette, 10/27/2023, 4122.25 (up)
- A{-4} Subminuette, 10/27/2023, 4122.25 (up)
Reading the chart. Price movements — waves – – in Elliott wave analysis are labeled with numbers within trending waves and letters with corrective waves. The subscripts — numbers in curly brackets — designate the wave’s degree, which, in Elliott wave analysis, means the relative position of a wave within the larger and smaller structures that make up the chart. R.N. Elliott, who in the 1930s developed the form of analysis that bears his name, viewed the chart as a complex structure of smaller waves nested within larger waves, which in turn are nested within still larger waves. In mathematics it’s called a fractal structure, where at every scale the pattern is similar to the others.
Learning and other resources. Elliott wave analysis provides context, not prophecy. As the 20th century semanticist Alfred Korzybski put it in his book Science and Sanity (1933), “The map is not the territory … The only usefulness of a map depends on similarity of structure between the empirical world and the map.” And I would add, in the ever-changing markets, we can judge that similarity of structure only after the fact.
See the menu page Analytical Methods for a rundown on where to go for information on Elliott wave analysis.
By Tim Bovee, Portland, Oregon, November 14, 2023
Disclaimer
Tim Bovee, Private Trader tracks the analysis and trades of a private trader for his own accounts. Nothing in this blog constitutes a recommendation to buy or sell stocks, options or any other financial instrument. The only purpose of this blog is to provide education and entertainment.
No trader is ever 100 percent successful in his or her trades. Trading in the stock and option markets is risky and uncertain. Each trader must make trading decisions for his or her own account, and take responsibility for the consequences.
License
All content on Tim Bovee, Private Trader by Timothy K. Bovee is licensed under a Creative Commons Attribution-ShareAlike 4.0 International License.
Based on a work at www.timbovee.com.

You must be logged in to post a comment.