6:30 p.m. New York time
QQQ Iron Fly entry. I’ve entered a short Iron Fly position on QQQ on the day before expiration and have posted an analysis of the trade.
3:30 p.m. New York time
Half an hour before the closing bell. The S&P 500 futures kept to a $15-range during the session, breaking out on a few occasions and quickly returning. The overnight high, 4541.25, hasn’t been challenged as wave A continues to search for its end point, The A wave is the initial wave within the 4th-wave upward correction that began in late October.
I’ve updated the chart.
9:35 a.m. New York time
What’s happening now? The S&P 500 E-mini futures continued the rise that began a day earlier, albeit at a slower pace. The price spiked upward to 4541.25 with the release of the Producer Price Index, which tracks how much producers get when they sell you widgets and other stuff, and then fell back, moving slightly below the 78.6% Fibonacci retracement level.
What does it mean? “Two houses, both alike in dignity.” That’s today’s chart, as it has been all week. Straight out of Romeo and Juliet.
The 4th-wave upward correction that began on October 27 continues and is near the end of its initial subwave, wave A (first scenario). That’s the Montagues.
Or, equally likely, the 4th-wave upward correction completed its initial subwave overnight and began its declining middle subwave, wave B (second scenario). That’s the Capulets.
Otherwise, there’s nothing new to say about the chart that hasn’t already been said earlier in the week as the battle between the warring houses, or scenarios, plays out.
Top federal reserve officials will be out in full force today and Thursday, making public appearances in which they may either confirm the happy-happy interest rate talk in the financial press following the release of inflation numbers on Tuesday, or perhaps will pour cold water on the whole idea that the Fed is ready to stop raising rates.
Although the markets move to the rhythmic waves discovered by R.N. Elliott when he invented Elliott Wave Analysis in the 1930s, economic reports and Fed jaw-boning can have a influence on the time and scope of those waves. So it’s worth keeping an ear cocked the rest of the week for what the Fed officials say.
What are the alternatives? The upper boundary of the 4th-wave upward correction is 4634.50, the beginning of the preceding 1st wave of the same degree. If the price goes above that level, then the degrees of the entire correction get moved up, making it a correction one-degree down from the January 4, 2022 peak, 4953.25, and that level becomes the new upward limit. We’re not there yet, but it’s a possibility.
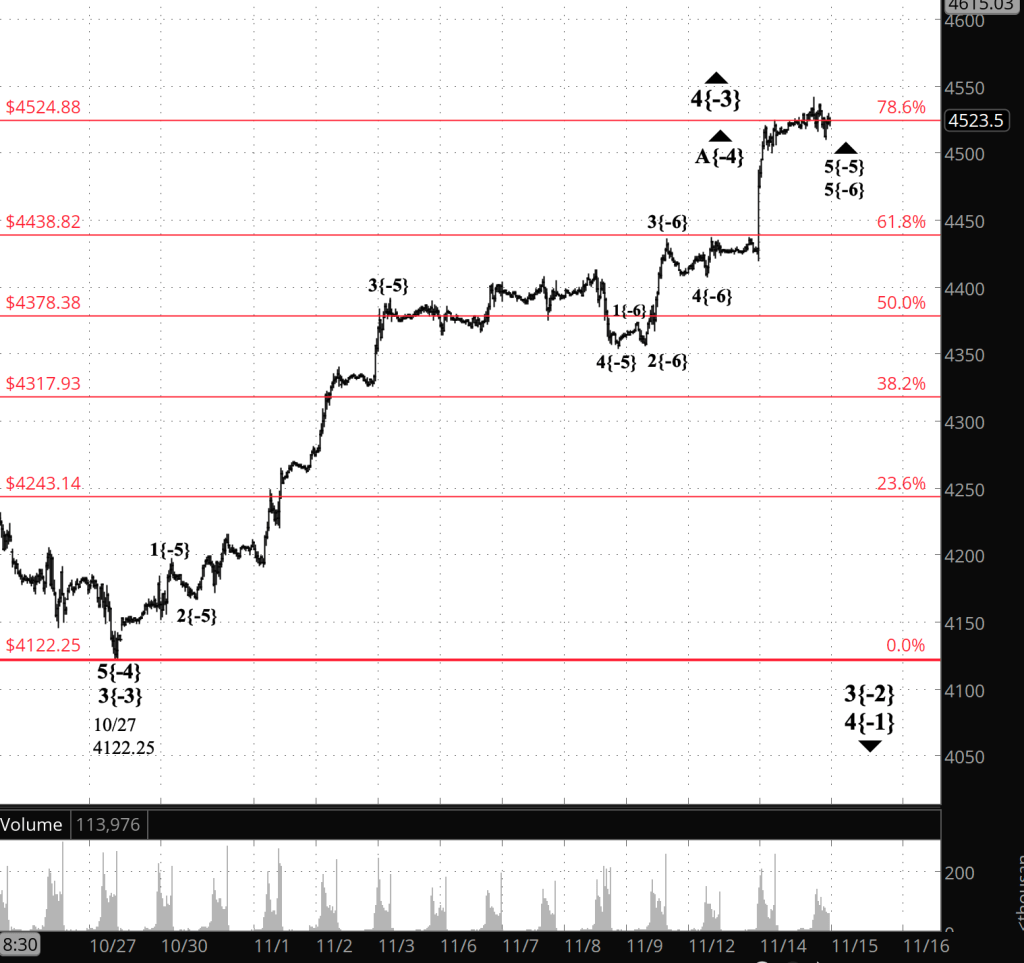
[S&P 500 E-mini futures at 3:30 p.m., 35-minute bars, with volume]
What does Elliott wave theory say? Here are the waves that underly the analyses.
Principal Analysis:
- A downtrend, wave 3{-2}, began on July 27 and is underway.
- Within wave 3{-2}, an upward correction, wave 4{-3}, began on October 27.
- Wave 4{-3} internally has two possibilities, each of equal likelihood:
- Scenario 1: Either rising wave A{-4} continues and is nearing it’s end.
- Scenario 2: Or wave A{-4} ended on November 10 at 4425.75 and wave B{-4} began from that point.
- Under the first scenario, wave A{-4} is its final subwave, wave 5{-5}, which in turn is in its final subwave, wave 5{-6}.
- Under the second scenario, declining wave B{-4} has begun and is in its initial subwave, wave A{-5}.
We Are Here.
These are the waves currently in progress under my principal analysis. Each line on the list shows the wave number, with the subscript in curly brackets, the traditional degree name, the starting date, the starting price of the S&P 500 E-mini futures, and the direction of the wave.
- S&P 500 Index:
- 5{+3} Supercycle, 7/8/1932, 4.40 (up)
- 5{+2} Cycle, 12/9/1974, 60.96 (up)
- 5{+1} Primary, 3/6/2009, 666.79 (up)
- 5{0} Intermediate, 12/26/2018, 2346.58 (up)
- S&P 500 Futures and index:
- 4{-1} Minor, 1/4/2022, 4953.25 (down) (futures), 4818.62 (down) (index)
- S&P 500 Futures:
- 3{-2} Minute, 7/27/2023, 4623.50 (down)
- 4{-3} Minuette, 10/27/2023, 4122.25 (up)
- A{-4} Subminuette, 10/27/2023, 4122.25 (up)
Reading the chart. Price movements — waves – – in Elliott wave analysis are labeled with numbers within trending waves and letters with corrective waves. The subscripts — numbers in curly brackets — designate the wave’s degree, which, in Elliott wave analysis, means the relative position of a wave within the larger and smaller structures that make up the chart. R.N. Elliott, who in the 1930s developed the form of analysis that bears his name, viewed the chart as a complex structure of smaller waves nested within larger waves, which in turn are nested within still larger waves. In mathematics it’s called a fractal structure, where at every scale the pattern is similar to the others.
Learning and other resources. Elliott wave analysis provides context, not prophecy. As the 20th century semanticist Alfred Korzybski put it in his book Science and Sanity (1933), “The map is not the territory … The only usefulness of a map depends on similarity of structure between the empirical world and the map.” And I would add, in the ever-changing markets, we can judge that similarity of structure only after the fact.
See the menu page Analytical Methods for a rundown on where to go for information on Elliott wave analysis.
By Tim Bovee, Portland, Oregon, November 15, 2023
Disclaimer
Tim Bovee, Private Trader tracks the analysis and trades of a private trader for his own accounts. Nothing in this blog constitutes a recommendation to buy or sell stocks, options or any other financial instrument. The only purpose of this blog is to provide education and entertainment.
No trader is ever 100 percent successful in his or her trades. Trading in the stock and option markets is risky and uncertain. Each trader must make trading decisions for his or her own account, and take responsibility for the consequences.
License
All content on Tim Bovee, Private Trader by Timothy K. Bovee is licensed under a Creative Commons Attribution-ShareAlike 4.0 International License.
Based on a work at www.timbovee.com.

[…] I’ve switched the labeling on the chart to what was the second scenario in yesterday’s analysis, promoting it to the status of principal […]
LikeLike