3:30 p.m. New York time
Half an hour before the closing bell. The S&P 500 futures began to rise overnight and picked up the pace five minutes before the session began, in total traveling from the 4520s to the 4570s, in five waves.
So, at every peak, we’re back to where we have been time and time again within this correction, where the peak could be the end of wave A within the 4th-wave upward correction, or not.
My description of the choices this morning still hold true this afternoon:
- Scenario 1: Wave A continues. The initial wave of the current 4th-wave upward correction is now underway and is nearing its end. The correction began on October 27.
- Scenario 2: Wave B has begun. The middle wave of the correction continues and is in its early stages.
After the present rise peaks (it’s still underway), then either scenario will have an equal probability of correctly describing the state of the chart.
3:05 p.m. New York time
Entered 1DTE SPY Iron Fly. I’ve entered an short Iron Fly position on SPY, one day to expiration, and have posted an analysis of the trade.
11:20 a.m. New York time
Wave A continues. The S&P 500 futures and index, and the exchange-traded fund SPY all moved above the November 15 peak, resolving the question of which of two scenarios, each of equal likelihood, will win the match. The victor: Scenario 1. The first subwave, wave A, of the 4th-wave upward correction continues and is nearing its end. When complete, it will be followed by a downward B wave. I’ve updated the chart below.
9:35 a.m. New York time
What’s happening now? The S&P 500 E-mini futures stayed close to the 78% Fibonacci retracement level, as it has since November 14.
What does it mean? The two scenarios on the chart at the end of last week remain as the new week begins. Each still has equal probability.
- Scenario 1: Wave A continues. The initial wave of the current 4th-wave upward correction is now underway and is nearing its end. The correction began on October 27.
- Scenario 2: Wave B has begun. The middle wave of the correction continues and is in its early stages.
Last week I switched the chart to Scenario 2 — Wave B has begun. If the price moves above 4541.25, the November 15 peak, then Scenario 1 is correct — wave A is still underway — and I’ll change the chart’s wave labeling. If the price takes a sharp turn to the downside, then Scenario B gains credibility and I’ll retain the present wave labeling.
What are the alternatives? None at this point, aside from the choice described above.
However, Thursday is a holiday for U.S. markets, and Friday will be a shortened trading session. Major holiday weeks like this generally take two forms, or so my observation tells me: Either the week is a total yawner, where nothing much happens. Or, less common, something totally unexpected and strange occurs. Such as, perhaps, a yet unknown third alternative.
We shall see.
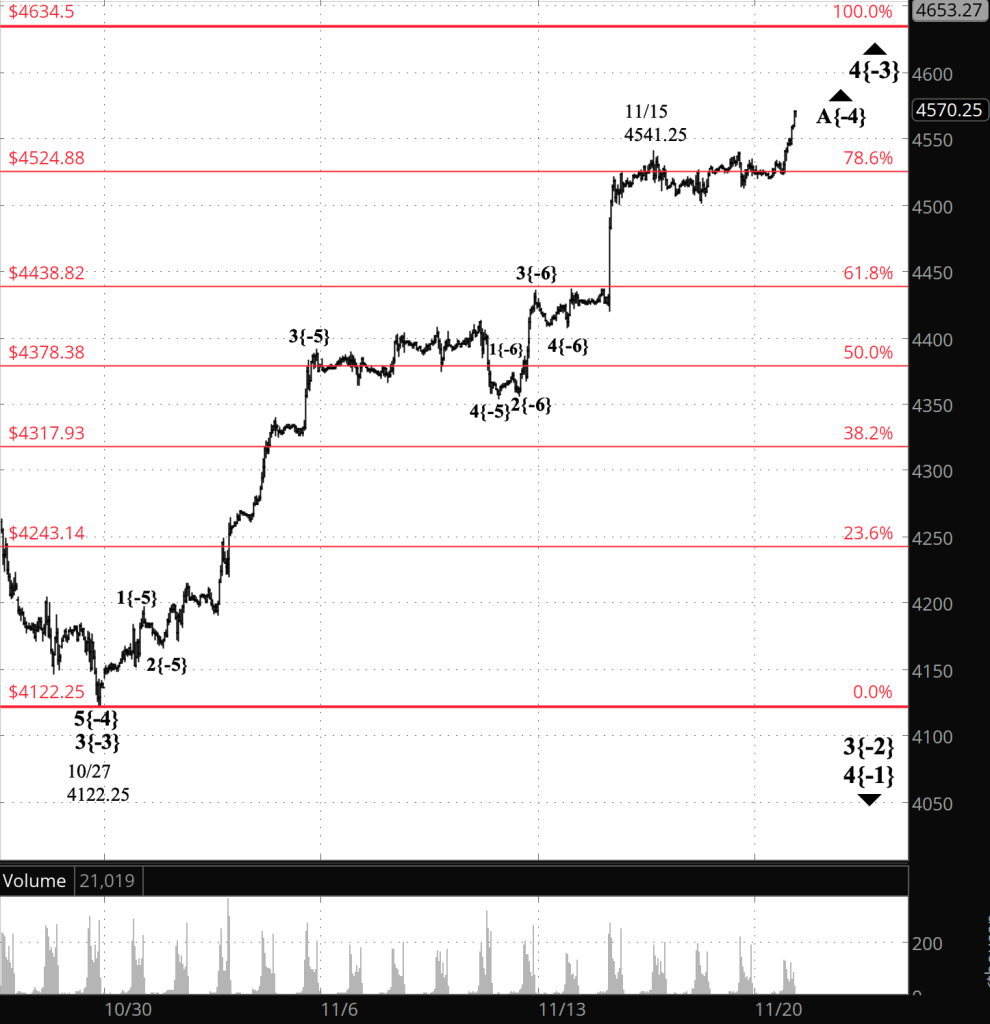
[S&P 500 E-mini futures at 3:30 p.m., 45-minute bars, with volume]
What does Elliott wave theory say? Here are the waves that underly the analyses.
- A downtrend, wave 3{-2}, began on July 27 and is underway.
- Within wave 3{-2}, an upward correction, wave 4{-3}, began on October 27.
- In this morning’s analysis, wave 4{-3} internally had two possibilities, each of equal likelihood:
- Scenario 1: Either rising wave A{-4} continues and is nearing it’s end.
- Scenario 2: Or wave A{-4} ended on November 10 at 4425.75 and wave B{-4} began from that point.
- The price moved above the correction’s prior high, resolving the ambiguity.
- Within wave 4{-3}, wave A{-4} continues.
We Are Here.
These are the waves currently in progress under my principal analysis. Each line on the list shows the wave number, with the subscript in curly brackets, the traditional degree name, the starting date, the starting price of the S&P 500 E-mini futures, and the direction of the wave.
- S&P 500 Index:
- 5{+3} Supercycle, 7/8/1932, 4.40 (up)
- 5{+2} Cycle, 12/9/1974, 60.96 (up)
- 5{+1} Primary, 3/6/2009, 666.79 (up)
- 5{0} Intermediate, 12/26/2018, 2346.58 (up)
- S&P 500 Futures and index:
- 4{-1} Minor, 1/4/2022, 4953.25 (down) (futures), 4818.62 (down) (index)
- S&P 500 Futures:
- 3{-2} Minute, 7/27/2023, 3502 (down)
- 4{-3} Minuette, 10/27/2023, 4122.25 (up)
- A{-4} Subminuette, 10/27/2023, 4122.25 (up()
Reading the chart. Price movements — waves – – in Elliott wave analysis are labeled with numbers within trending waves and letters with corrective waves. The subscripts — numbers in curly brackets — designate the wave’s degree, which, in Elliott wave analysis, means the relative position of a wave within the larger and smaller structures that make up the chart. R.N. Elliott, who in the 1930s developed the form of analysis that bears his name, viewed the chart as a complex structure of smaller waves nested within larger waves, which in turn are nested within still larger waves. In mathematics it’s called a fractal structure, where at every scale the pattern is similar to the others.
Learning and other resources. Elliott wave analysis provides context, not prophecy. As the 20th century semanticist Alfred Korzybski put it in his book Science and Sanity (1933), “The map is not the territory … The only usefulness of a map depends on similarity of structure between the empirical world and the map.” And I would add, in the ever-changing markets, we can judge that similarity of structure only after the fact.
See the menu page Analytical Methods for a rundown on where to go for information on Elliott wave analysis.
By Tim Bovee, Portland, Oregon, November 20, 2023
Disclaimer
Tim Bovee, Private Trader tracks the analysis and trades of a private trader for his own accounts. Nothing in this blog constitutes a recommendation to buy or sell stocks, options or any other financial instrument. The only purpose of this blog is to provide education and entertainment.
No trader is ever 100 percent successful in his or her trades. Trading in the stock and option markets is risky and uncertain. Each trader must make trading decisions for his or her own account, and take responsibility for the consequences.
License
All content on Tim Bovee, Private Trader by Timothy K. Bovee is licensed under a Creative Commons Attribution-ShareAlike 4.0 International License.
Based on a work at www.timbovee.com.

You must be logged in to post a comment.