3:30 p.m. New York time
Half an hour before the closing bell. The S&P 500 futures fell during the session to the 4530s and then began to rise. I see the decline as part of a downward correction within a much larger upward correction.
In terms of Elliott Wave numbers, we’re seeing wave A of a very small degree falling 4th-wave correction buried several degrees deep within the rising A wave of a larger 4th-degree upward correction, and the subsequent rise as a very small degree B wave.
I’ve updated the chart but haven’t tried to label the small-degree waves. No room!
2:45 p.m. New York time
Entered short Iron Fly position on QQQ. I’ve entered a short Iron Fly position on QQQ, one day prior to expiration, and have posted an analysis of the trade.
2:15 p.m. New York time
Exited short Iron Fly position on SPY. I’ve exited my short Iron Fly position on SPY, one day after entry, for a 15.3% profit and have updated the trade analysis with full details of the outcome.
9:35 a.m. New York time
What’s happening now? The S&P 500 E-mini futures declined overnight, from yesterday’s session high, 4571, into the 4550s.
What does it mean? The decline brings us back to where we’ve been since the November 15 peak. Withi the 4th-wave upward correction that began on October 27, each peak is potentially the end of the first subwave, rising wave A, and and the beginning of the middle wave, declining wave B. Although not necessarily.
In the following discussion I’ll need to use Elliott Wave degree indicators, showing a wave’s place within the fractal structure of the chart. The degrees are denoted by a subscript in curly brackets showing the wave’s relation to the Intermediate degree, which has the subscript {0}. A negative degree indicator means the wave is of a smaller degree than Intermediate.
The present wave upward correction is wave 4{-3}. The ensuing discussion will involve subwaves of wave 4[-3}.
Many Elliott Wave structures can be counted in several different ways. The present rise, wave 5{-5}, began on November 9. The subsequent November 15 peak is clearly a 3rd wave, but of what degree? It’s tempting to label it wave 3{-6}, one degree down from wave 5{-5}, but that would ignore the initial wave up, wave 1{-6}, giving a distorted look to the chart.
The alternative is to treat the subwaves after the end of wave 4{-6} as being one degree lower. Doing so means that 5{-7} within wave 5{-6} is underway. When wave 5{-7} is complete, it will also be the end of wave 5{-6} and the first subwave in the correction, wave A{-5}.
And what of yesterday’s rise? I count it as having completed it’s 3rd subwave at the November 20 peak: Wave 3{-8}. The overnight dip is wave 4{-8}, and it will be followed by rising wave 5{-8}, whose end will cascade up the fractal structure to also be the end of waves 5{-7}, 5{-6}, and A{-4}.
What are the alternatives? That analysis resolves the larger ambiguity of the chart: Is wave A complete or not? By my analysis, it isn’t done yet. One more push to the upside, and that will be the end of wave A and the start of wave B.
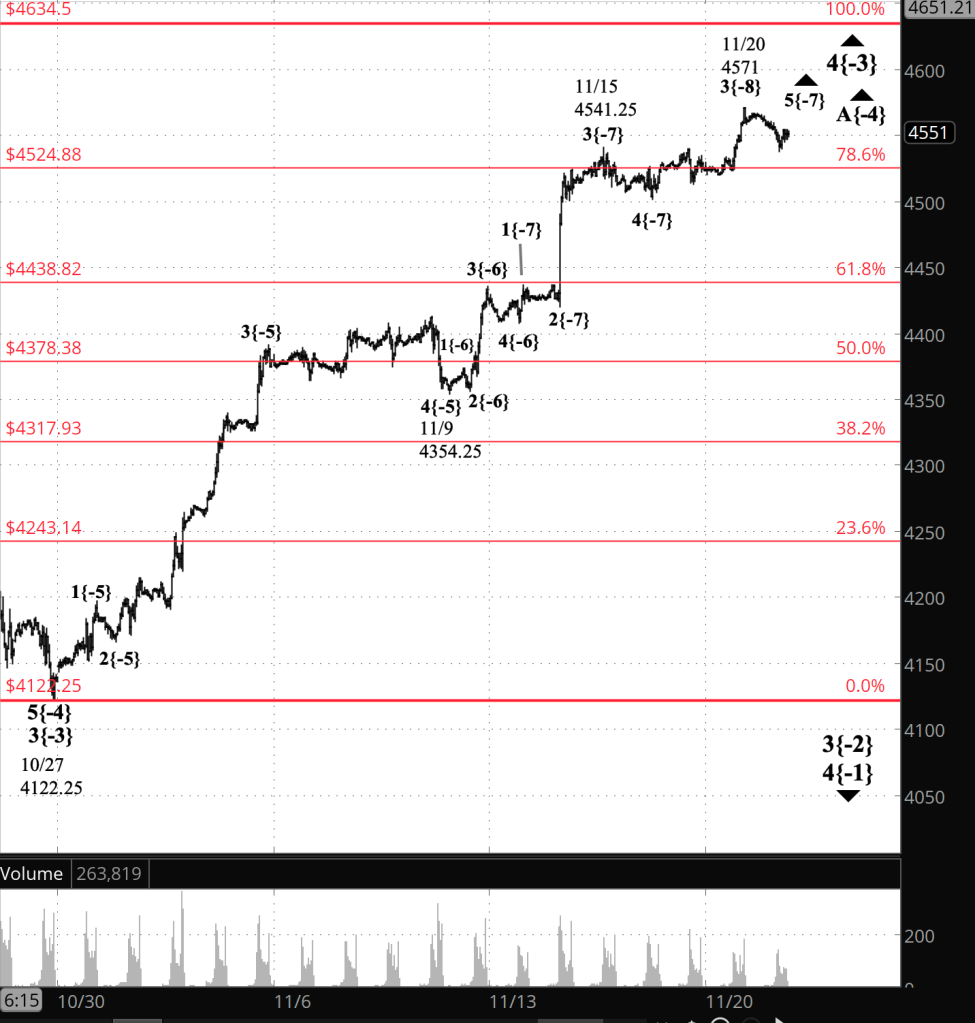
[S&P 500 E-mini futures at 3:30 p.m., 45-minute bars, with volume]
What does Elliott wave theory say? Here are the waves that underly the analyses.
- A downtrend, wave 3{-2}, began on July 27 and is underway.
- Within wave 3{-2}, an upward correction, wave 4{-3}, began on October 27.
- Within wave 4{-3}, wave A{-4} continues.
We Are Here.
These are the waves currently in progress under my principal analysis. Each line on the list shows the wave number, with the subscript in curly brackets, the traditional degree name, the starting date, the starting price of the S&P 500 E-mini futures, and the direction of the wave.
- S&P 500 Index:
- 5{+3} Supercycle, 7/8/1932, 4.40 (up)
- 5{+2} Cycle, 12/9/1974, 60.96 (up)
- 5{+1} Primary, 3/6/2009, 666.79 (up)
- 5{0} Intermediate, 12/26/2018, 2346.58 (up)
- S&P 500 Futures and index:
- 4{-1} Minor, 1/4/2022, 4953.25 (down) (futures), 4818.62 (down) (index)
- S&P 500 Futures:
- 3{-2} Minute, 7/27/2023, 3502 (down)
- 4{-3} Minuette, 10/27/2023, 4122.25 (up)
- A{-4} Subminuette, 10/27/2023, 4122.25 (up)
Reading the chart. Price movements — waves – – in Elliott wave analysis are labeled with numbers within trending waves and letters with corrective waves. The subscripts — numbers in curly brackets — designate the wave’s degree, which, in Elliott wave analysis, means the relative position of a wave within the larger and smaller structures that make up the chart. R.N. Elliott, who in the 1930s developed the form of analysis that bears his name, viewed the chart as a complex structure of smaller waves nested within larger waves, which in turn are nested within still larger waves. In mathematics it’s called a fractal structure, where at every scale the pattern is similar to the others.
Learning and other resources. Elliott wave analysis provides context, not prophecy. As the 20th century semanticist Alfred Korzybski put it in his book Science and Sanity (1933), “The map is not the territory … The only usefulness of a map depends on similarity of structure between the empirical world and the map.” And I would add, in the ever-changing markets, we can judge that similarity of structure only after the fact.
See the menu page Analytical Methods for a rundown on where to go for information on Elliott wave analysis.
By Tim Bovee, Portland, Oregon, November 21, 2023
Disclaimer
Tim Bovee, Private Trader tracks the analysis and trades of a private trader for his own accounts. Nothing in this blog constitutes a recommendation to buy or sell stocks, options or any other financial instrument. The only purpose of this blog is to provide education and entertainment.
No trader is ever 100 percent successful in his or her trades. Trading in the stock and option markets is risky and uncertain. Each trader must make trading decisions for his or her own account, and take responsibility for the consequences.
License
All content on Tim Bovee, Private Trader by Timothy K. Bovee is licensed under a Creative Commons Attribution-ShareAlike 4.0 International License.
Based on a work at www.timbovee.com.

You must be logged in to post a comment.