3:30 p.m. New York time
Half an hour before the closing bell. The S&P 500 stayed within the 4550s to 4570s, perhaps a result of traders waiting for the big early-morning report days of the week: A GDP revision on Tuesday and PCE inflation numbers, part of the GDP, on Wednesday, each at 8:30 a.m. New York time.
Meanwhile, this morning’s analysis stands. I’ve updated the lower, long-term chart.
1 p.m. New York time
SPY, QQQ entry 1DTE. I’ve entered very short term position positions on SPY and QQQ, one day before expiration, and have posted analyses of the trades.
9:35 a.m. New York time
What’s happening now? The S&P 500 E-mini futures opened in the 4560s when trading resumed overnight, fell into the 4550s, and then rose again into the 4560s. The price remained below the peak of the ongoing 4th-wave upward correction, 4580.50 on November 23.
What does it mean? The question, as always in the past week, is whether that most recent peak is the end of the first subwave of the correction, wave A, or whether their is a bit more upside left. Under the rules of Elliott Wave Theory, the correction has an upper limit of 4634.50, the end of the preceding 1st wave on July 27, so if there is more upside to the upward correction, it’s not a lot, especially when considering that the upper limit will apply also to the third and final subwave of the correction, wave C.
From this point I’ll use the Elliott wave nomenlature that appears on the chart: A wave number followed by a degree number showing the wave’s position within the fractal hierarchy of the chart as the number of degrees below (in this case) the intermediate degree, which is presently in wave 5{-0}, beginning in December 2018.
The November 23 peak was the end of wave 3{-8}, six degrees below wave 4{-3}, which is the correction, and A{-4}, the first subwave of the correction. A shallow correction wave 4{-8}, followed, bringing the price down to the end of wave A{-9}. Rising wave B{-9} is now underway and will be followed by falling wave C{-9}, the final subwave of wave 4{-8}.
Wave 5{-8} will follow. And this is where things get interesting. Wave 5{-8} is a subwave of a stack of 5th waves reaching up to wave 5{-5}, the final subwave of the A wave, which in turn is the first wave of the correction. So when wave 5{-8} reaches its end, it will also be the end of all of those 5th waves in the stack, and the end of wave A{-4}.
The declining middle wave of the correction will follow, wave B{-4}. Wave A{-4} will end up with five subwaves, and so is taking the form of a Zigzag. The B wave in a Zigzag typically retraces 38% to 79% of the preceding A wave, which began on October 27 from 4122.25 and when finished, will have taken more than a month to reach completion. We have some downward trending weeks ahead of us.
Here is a close-up chart showing wave 5{-8} a half an hour before the opening bell.
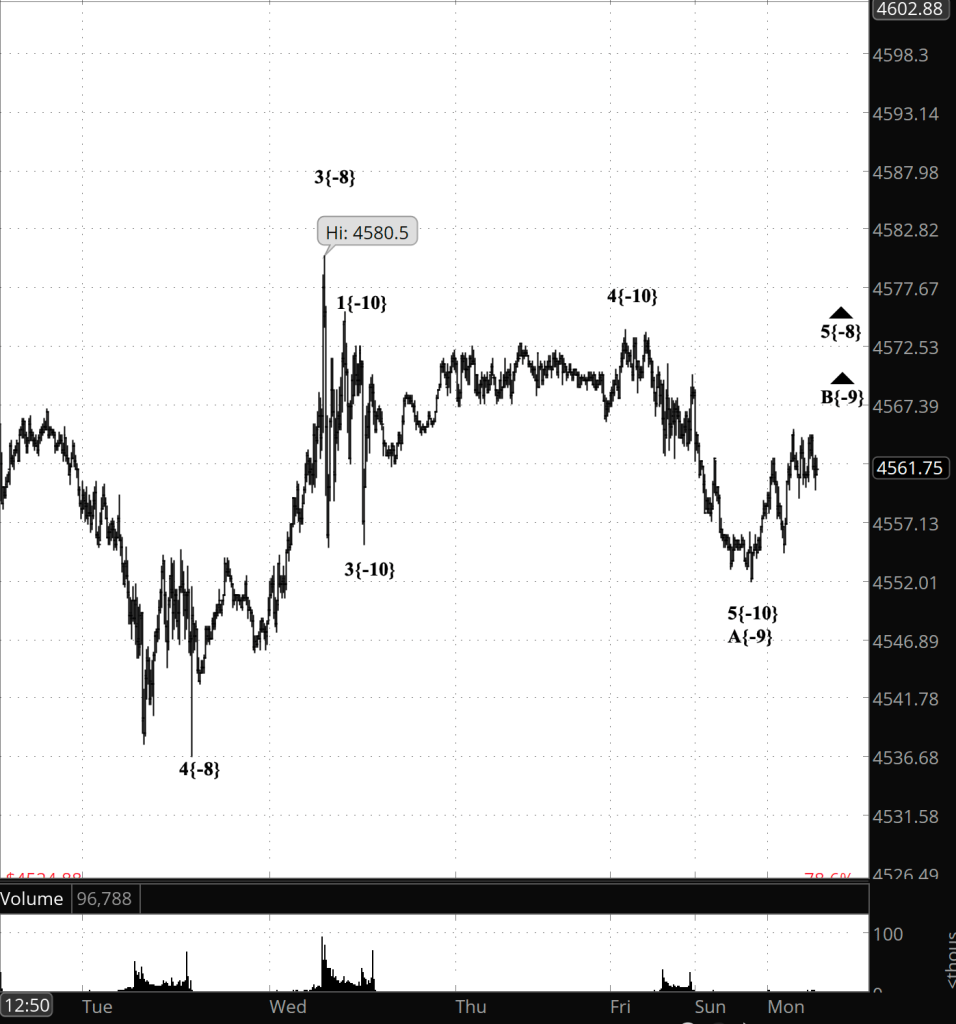
[S&P 500 E-mini futures at 9 a.m., 10-minute bars, with volume]
What are the alternatives? At the higher level, we have two alternatives, each of almost equal likelihood.
- Scenario #1: Rising wave A ended continues to work through it’s 5th and final wave, or
- Scenario #2: Rising wave A ended on November 22 and falling wave B has begun.
The small-wave count described above lends a bit more weight to Scenario #1, and that’s what I’ve used in the charts as my principal analysis.
The chart below shows wave A{-4} in its entirely so far.
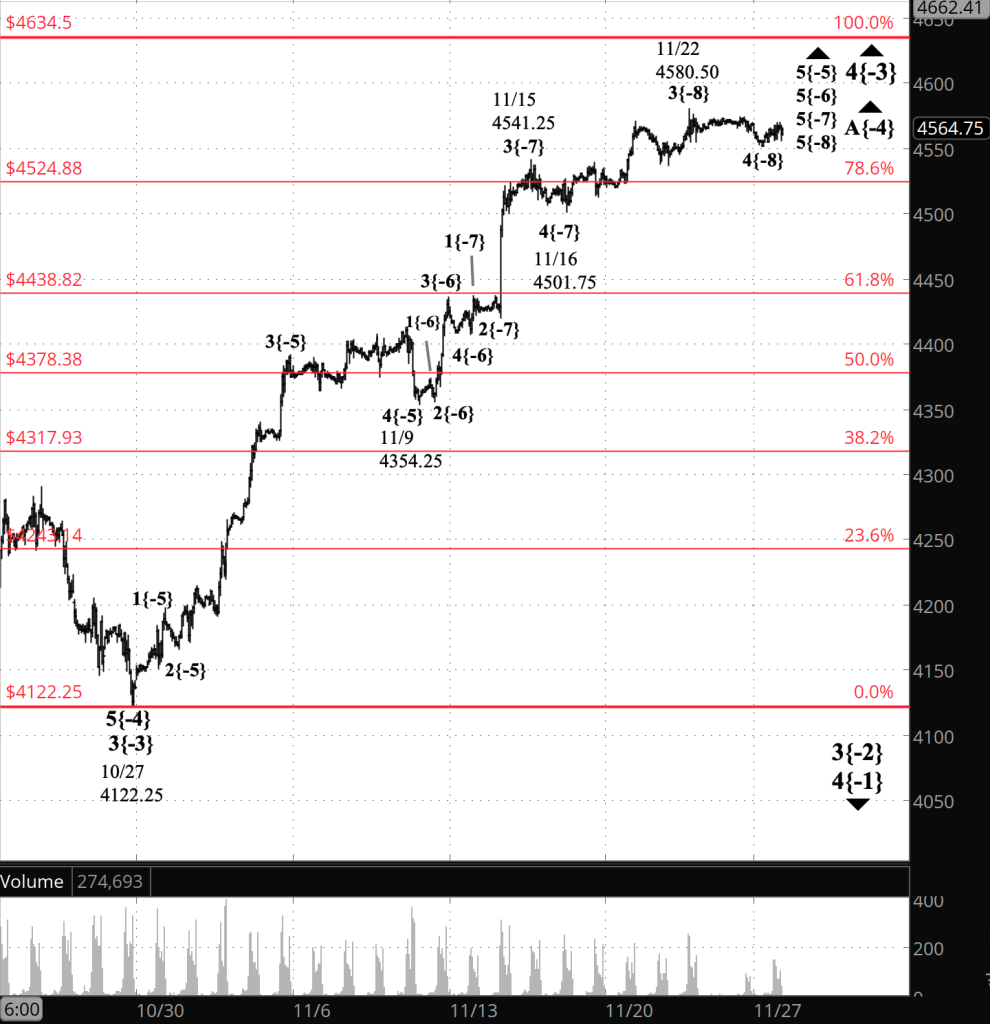
[S&P 500 E-mini futures at 3:30 p.m., hourly bars, with volume]
What does Elliott wave theory say? Here are the waves that underly the analyses.
- A downtrend, wave 3{-2}, began on July 27 and is underway.
- Within wave 3{-2}, an upward correction, wave 4{-3}, began on October 27.
- Lower still, two scenarios of equal probability:
- Scenario #1:
- Within wave 4{-3}, wave A{-4} continues.
- Further down the list, wave 5{-5}, 6{-5}, 7{-5} and 8{-5} are underway and nearing completion.
- Scenario #2:
- Wave A{-4} ended on November 22 and wave B{-4} began its downward trek.
- Scenario #1:
We Are Here.
These are the waves currently in progress under my principal analysis. Each line on the list shows the wave number, with the subscript in curly brackets, the traditional degree name, the starting date, the starting price of the S&P 500 E-mini futures, and the direction of the wave.
- S&P 500 Index:
- 5{+3} Supercycle, 7/8/1932, 4.40 (up)
- 5{+2} Cycle, 12/9/1974, 60.96 (up)
- 5{+1} Primary, 3/6/2009, 666.79 (up)
- 5{0} Intermediate, 12/26/2018, 2346.58 (up)
- S&P 500 Futures and index:
- 4{-1} Minor, 1/4/2022, 4953.25 (down) (futures), 4818.62 (down) (index)
- S&P 500 Futures:
- 3{-2} Minute, 7/27/2023, 3502 (down)
- 4{-3} Minuette, 10/27/2023, 4122.25 (up)
- A{-4} Subminuette, 10/27/2023, 4122.25 (up)
Reading the chart. Price movements — waves – – in Elliott wave analysis are labeled with numbers within trending waves and letters with corrective waves. The subscripts — numbers in curly brackets — designate the wave’s degree, which, in Elliott wave analysis, means the relative position of a wave within the larger and smaller structures that make up the chart. R.N. Elliott, who in the 1930s developed the form of analysis that bears his name, viewed the chart as a complex structure of smaller waves nested within larger waves, which in turn are nested within still larger waves. In mathematics it’s called a fractal structure, where at every scale the pattern is similar to the others.
Learning and other resources. Elliott wave analysis provides context, not prophecy. As the 20th century semanticist Alfred Korzybski put it in his book Science and Sanity (1933), “The map is not the territory … The only usefulness of a map depends on similarity of structure between the empirical world and the map.” And I would add, in the ever-changing markets, we can judge that similarity of structure only after the fact.
See the menu page Analytical Methods for a rundown on where to go for information on Elliott wave analysis.
By Tim Bovee, Portland, Oregon, November 27, 2023
Disclaimer
Tim Bovee, Private Trader tracks the analysis and trades of a private trader for his own accounts. Nothing in this blog constitutes a recommendation to buy or sell stocks, options or any other financial instrument. The only purpose of this blog is to provide education and entertainment.
No trader is ever 100 percent successful in his or her trades. Trading in the stock and option markets is risky and uncertain. Each trader must make trading decisions for his or her own account, and take responsibility for the consequences.
License
All content on Tim Bovee, Private Trader by Timothy K. Bovee is licensed under a Creative Commons Attribution-ShareAlike 4.0 International License.
Based on a work at www.timbovee.com.

You must be logged in to post a comment.