3:30 p.m. New York time
Half an hour before the closing bell. The S&P 500 futures ranged from the 4540s to the 4507s. The decline from the November 29 peak was, in today’s session, either in a 4th-wave correction or a 2nd-wave correction within the 3rd wave one degree smaller. This morning’s analysis is unchanged. I’ve updated the chart.
2:30 p.m. New York time
Trades. I entered three new positions today: Short Iron Fly options spreads that expire the next day; 1DTE trades in the jargon. Two have options with daily expirations: SPY and QQQ. The third is one of a large number of options that expire weekly, on Fridays, and so offer 1DTE trading opportunities only on Thursday. I’ve posted the trade analyses.
Also, two days late, I updated my November 27 trade analyses of SPY and QQQ with the next days exit and results.
9:35 a.m. New York time
What’s happening now? The S&P 500 E-mini futures traded sideways for much of the night, rising slightly as the release of the Personal Consumption Expenditures (PCE) inflation stats drew near. The PCE release resulted in a 7-point whipsaw that ended up about where it had begun. The price then rose a bit higher, to 4578.25, and then retreated to the 4560s.
What does it mean? The price overnight remained below the most recent high, 4597 on Wednesday, as the upward 4th-wave correction that began on October 27 continues to work through its first subwave, the A wave. That initial wave is in its 5th and final subwave. It will be followed by declning wave B, which typically will retrace 38% to 79% of the A wave.
What are the alternatives? Any high at this point could be the end of wave A, or not. It’s possible that Wednesday’s peak was the end of the 5th and final subwave within wave A, and that wave B has begun.
The Chart. The chart shows the Elliott Wave numbers and a subscript, in curly brackets, designating the degree of each wave, which is the relative size of the wave within the fractal structure that is the stock price chart.
The upward correction is wave 4{-3}. The smallest degree I’m tracking — and the current wave on the chart — is wave 5{-8}. Between the two are three 5th waves, each one degree larger, and the initial subwave of the correction, wave A{-5}. When wave 5{-8} is complete, it will cascade up the degrees, also marking the end of the 5th waves and of wave A{-5}.
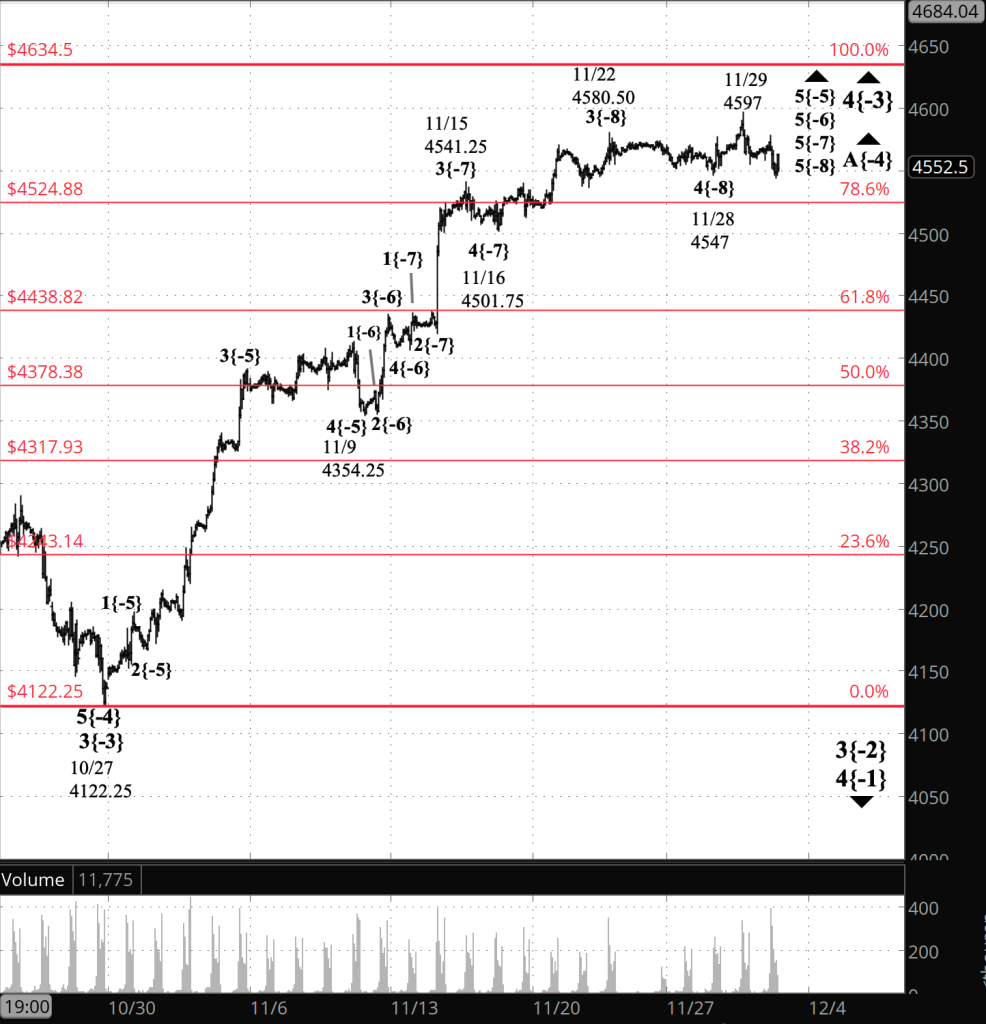
[S&P 500 E-mini futures at 3:30 p.m., 70-minute bars, with volume]
What does Elliott wave theory say? Here are the waves that underly the analyses.
Principal Analysis:
- A downtrend, wave 3{-2}, began on July 27 and is underway.
- Within wave 3{-2}, an upward correction, wave 4{-3}, began on October 27.
- The initial wave of the correction, wave A{-4}, continues.
- Wave A{-4} has reached its 5th and final subwave, wave 5{-5} and a series of smaller 5th waes, down to wave 5{-8}. When the smallest of the 5th waves is complete, it will cascade up, also ending wave 5{-5} and its parent, wave A{-4}.
Alternative Analysis:
- Wave A{-4} ended on November 29 and wave B{-4} began its downward journey..
We Are Here.
These are the waves currently in progress under my principal analysis. Each line on the list shows the wave number, with the subscript in curly brackets, the traditional degree name, the starting date, the starting price of the S&P 500 E-mini futures, and the direction of the wave.
- S&P 500 Index:
- 5{+3} Supercycle, 7/8/1932, 4.40 (up)
- 5{+2} Cycle, 12/9/1974, 60.96 (up)
- 5{+1} Primary, 3/6/2009, 666.79 (up)
- 5{0} Intermediate, 12/26/2018, 2346.58 (up)
- S&P 500 Futures and index:
- 4{-1} Minor, 1/4/2022, 4953.25 (down) (futures), 4818.62 (down) (index)
- S&P 500 Futures:
- 3{-2} Minute, 7/27/2023, 3502 (down)
- 4{-3} Minuette, 10/27/2023, 4122.25 (up)
- A{-4} Subminuette, 10/27/2023, 4122.25 (up)
Reading the chart. Price movements — waves – – in Elliott wave analysis are labeled with numbers within trending waves and letters with corrective waves. The subscripts — numbers in curly brackets — designate the wave’s degree, which, in Elliott wave analysis, means the relative position of a wave within the larger and smaller structures that make up the chart. R.N. Elliott, who in the 1930s developed the form of analysis that bears his name, viewed the chart as a complex structure of smaller waves nested within larger waves, which in turn are nested within still larger waves. In mathematics it’s called a fractal structure, where at every scale the pattern is similar to the others.
Learning and other resources. Elliott wave analysis provides context, not prophecy. As the 20th century semanticist Alfred Korzybski put it in his book Science and Sanity (1933), “The map is not the territory … The only usefulness of a map depends on similarity of structure between the empirical world and the map.” And I would add, in the ever-changing markets, we can judge that similarity of structure only after the fact.
See the menu page Analytical Methods for a rundown on where to go for information on Elliott wave analysis.
By Tim Bovee, Portland, Oregon, November 30, 2023
Disclaimer
Tim Bovee, Private Trader tracks the analysis and trades of a private trader for his own accounts. Nothing in this blog constitutes a recommendation to buy or sell stocks, options or any other financial instrument. The only purpose of this blog is to provide education and entertainment.
No trader is ever 100 percent successful in his or her trades. Trading in the stock and option markets is risky and uncertain. Each trader must make trading decisions for his or her own account, and take responsibility for the consequences.
License
All content on Tim Bovee, Private Trader by Timothy K. Bovee is licensed under a Creative Commons Attribution-ShareAlike 4.0 International License.
Based on a work at www.timbovee.com.

You must be logged in to post a comment.