3:30 p.m. New York time
Half an hour before the closing bell. The S&P 500 futures crept to a new high during the session, lending credence to this morning’s principal analysis. Wave A within the upward 4th-wave correction that began on October 27 continues. Unless, of course, the new peak is the end of wave A and the beginning of wave B. I’ve updated the chart.
12:05 p.m. New York time
Trades. I exited three positions during the first five minutes of the session, all of them 1DTE trades on expiration day: SPY, QQQ and AAPL. The outcome of the three taken together was a half a percent loss. SPY and QQQ were profitable, APPL produced a loss. I’ve updated the trade analyses with full results.
9:35 a.m. New York time
What’s happening now? The S&P 500 E-mini futures traded sideways for much of the night, then rose to the 4580s and fell to the 4560s.
What does it mean? In the discussion that follows,, the subscripts in curly brackets, both here and on the chart, indicate the waves position within the fractal structure in relation to the Intermediate degree, {0}.
The first subwave, an A wave, within the 4th wave upward correction that began on October 27 continues to play its end game. I count the A wave as being in its 5th and final subwave, from one degree lower in the fractal structure of the chart to four degrees lower. When the smallest of these, wave 5{-8} in the Elliott wave nomenclature, reaches its end, it will cascade up the structure, also ending wave 5{-5} and wave A{-4} within the upward correction, wave 4{-3}.
The October 29 peak was the highest point so far of the 4th-wave upward correction and may have ended the A wave and the smaller 5th waves within it. Or not. A rise above that peak, 4597, will mean that the 5th wave is still underway. A decisive decline will mean that wave A ended at that peak and declining wave B has begun. A final subwave, rising wave C, will complete the correction and a downtrending 5th wave will follow.
What are the alternatives? I’ve chosen to retain the smaller 5th waves and their parent, wave A, as still being underway for my principal analysis., relegating the scenario that sees wave A ending at the November 29 high and wave B as being underway to alternative status.
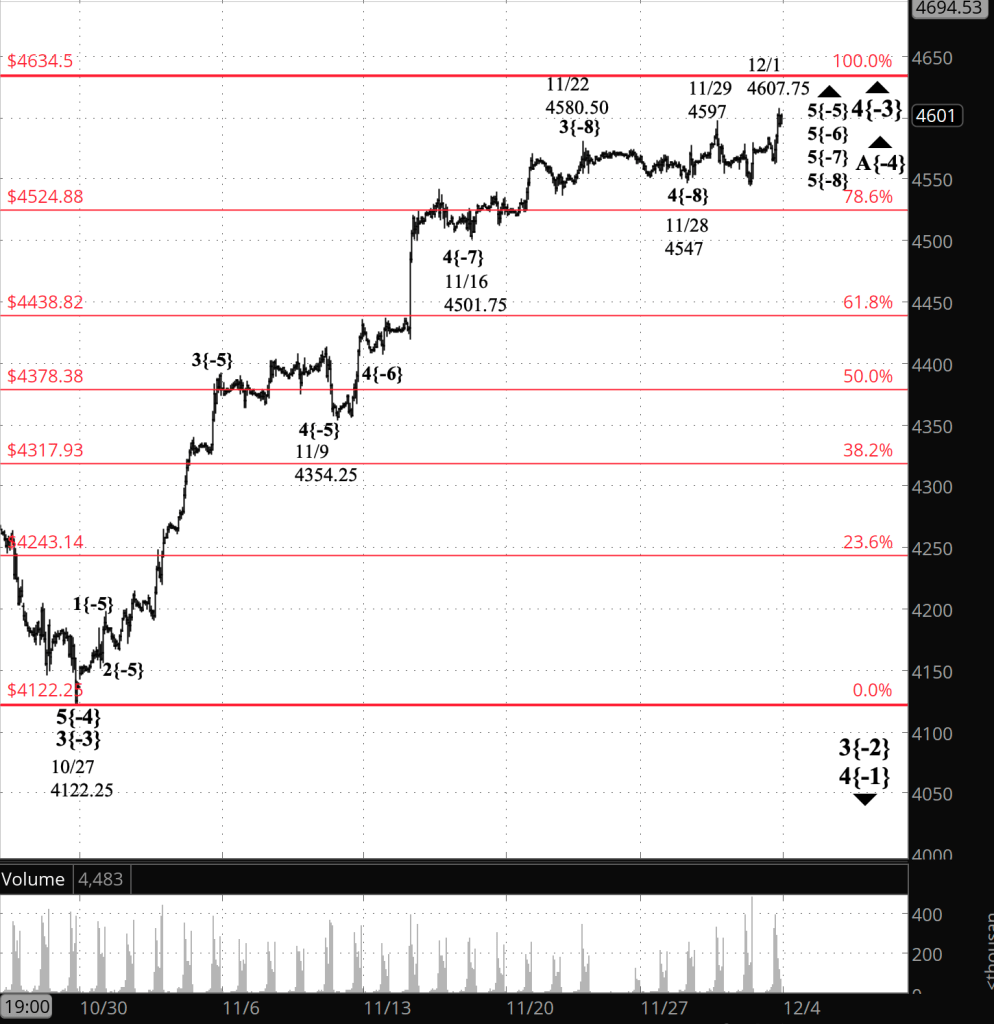
[S&P 500 E-mini futures at 3:30 p.m., 70-minute bars, with volume]
What does Elliott wave theory say? Here are the waves that underly the analyses.
Principal Analysis:
- A downtrend, wave 3{-2}, began on July 27 and is underway.
- Within wave 3{-2}, an upward correction, wave 4{-3}, began on October 27.
- The initial wave of the correction, wave A{-4}, continues.
- Wave A{-4} has reached its 5th and final subwave, wave 5{-5} and a series of smaller 5th waes, down to wave 5{-8}. When the smallest of the 5th waves is complete, it will cascade up, also ending wave 5{-5} and its parent, wave A{-4}.
Alternative Analysis:
- Wave A{-4} ended on November 29 and wave B{-4} began its downward journey.
We Are Here.
These are the waves currently in progress under my principal analysis. Each line on the list shows the wave number, with the subscript in curly brackets, the traditional degree name, the starting date, the starting price of the S&P 500 E-mini futures, and the direction of the wave.
- S&P 500 Index:
- 5{+3} Supercycle, 7/8/1932, 4.40 (up)
- 5{+2} Cycle, 12/9/1974, 60.96 (up)
- 5{+1} Primary, 3/6/2009, 666.79 (up)
- 5{0} Intermediate, 12/26/2018, 2346.58 (up)
- S&P 500 Futures and index:
- 4{-1} Minor, 1/4/2022, 4953.25 (down) (futures), 4818.62 (down) (index)
- S&P 500 Futures:
- 3{-2} Minute, 7/27/2023, 3502 (down)
- 4{-3} Minuette, 10/27/2023, 4122.25 (up)
- A{-4} Subminuette, 10/27/2023, 4122.25 (up)
Reading the chart. Price movements — waves – – in Elliott wave analysis are labeled with numbers within trending waves and letters with corrective waves. The subscripts — numbers in curly brackets — designate the wave’s degree, which, in Elliott wave analysis, means the relative position of a wave within the larger and smaller structures that make up the chart. R.N. Elliott, who in the 1930s developed the form of analysis that bears his name, viewed the chart as a complex structure of smaller waves nested within larger waves, which in turn are nested within still larger waves. In mathematics it’s called a fractal structure, where at every scale the pattern is similar to the others.
Learning and other resources. Elliott wave analysis provides context, not prophecy. As the 20th century semanticist Alfred Korzybski put it in his book Science and Sanity (1933), “The map is not the territory … The only usefulness of a map depends on similarity of structure between the empirical world and the map.” And I would add, in the ever-changing markets, we can judge that similarity of structure only after the fact.
See the menu page Analytical Methods for a rundown on where to go for information on Elliott wave analysis.
By Tim Bovee, Portland, Oregon, December 1, 2023
Disclaimer
Tim Bovee, Private Trader tracks the analysis and trades of a private trader for his own accounts. Nothing in this blog constitutes a recommendation to buy or sell stocks, options or any other financial instrument. The only purpose of this blog is to provide education and entertainment.
No trader is ever 100 percent successful in his or her trades. Trading in the stock and option markets is risky and uncertain. Each trader must make trading decisions for his or her own account, and take responsibility for the consequences.
License
All content on Tim Bovee, Private Trader by Timothy K. Bovee is licensed under a Creative Commons Attribution-ShareAlike 4.0 International License.
Based on a work at www.timbovee.com.

You must be logged in to post a comment.