3:30 p.m. New York time
Half an hour before the closing bell. The S&P 500 futures declined from its overnight high, 4794.75, into the 4750s. This morning’s analysis stands: Wave C within the 2nd-wave upward correction now underway is in its late stage, finishing off a wave of low degree before reaching an end. I’ve udpated the chart.
1:45 p.m. New York time
Trade. I’ve entered a short Iron Fly position on EWZ, the exchange-traded fund tracking markets in Brazil. It expires tomorrow, so it’s a 1DTE trade. I’ve posted an analysis of the trade.
9:35 a.m. New York time
What’s happening now? The S&P 500 E-mini futures rose in overnight trading, from yesterday’s session low, 4743.25, back into the 4790s. The price remained well below the high in the rise that began in October of last year, set on December 19 at 3830.75.
What does it mean? I take the sharp decline on December 20 to be evidence that the 3rd subwave within wave C, the final subwave of the 2nd-wave corrective pattern that began on October 13, 2023, ended at the December 19 peak.
Although I have changed the labeling on the chart to show the low-degree 3rd wave within wave C as having ended and the subsequent 4th wave having begun, there is still a significant chance that the 3rd wave is still underway. The energy of the decline suggests that wave 3 is over, but it’s not a certainty. The name of the game today is, “Wait and See”.
And there is yet another ambiguity, which I’ve listed as an alternative.
In any case, rising wave 3 is five levels below the C wave in the fractal structure of the chart, as is declining wave 4. The 4th wave will be followed by a rising subwave that will complete wave C and also, most likely, the 2nd wave upward correction. The end of the correction will be delayed if it takes a complex form, containing two or three corrective patterns.
What are the alternatives? It’s possible to count the low degree wave 3 as having ended on December 14. If that proves to be the case, then the December 19 high was the end of the 5th subwave buried within the C wave of the correction, the correction may have ended along with that C wave, and the decline that followed is the early stage of a downtrending 3rd wave that will carry the price a great deal lower.
The Chart. The Fibonacci retracement ladder appears on the chart in red. The shows the C wave’s retracement of the first subwave of the correction, the A wave.
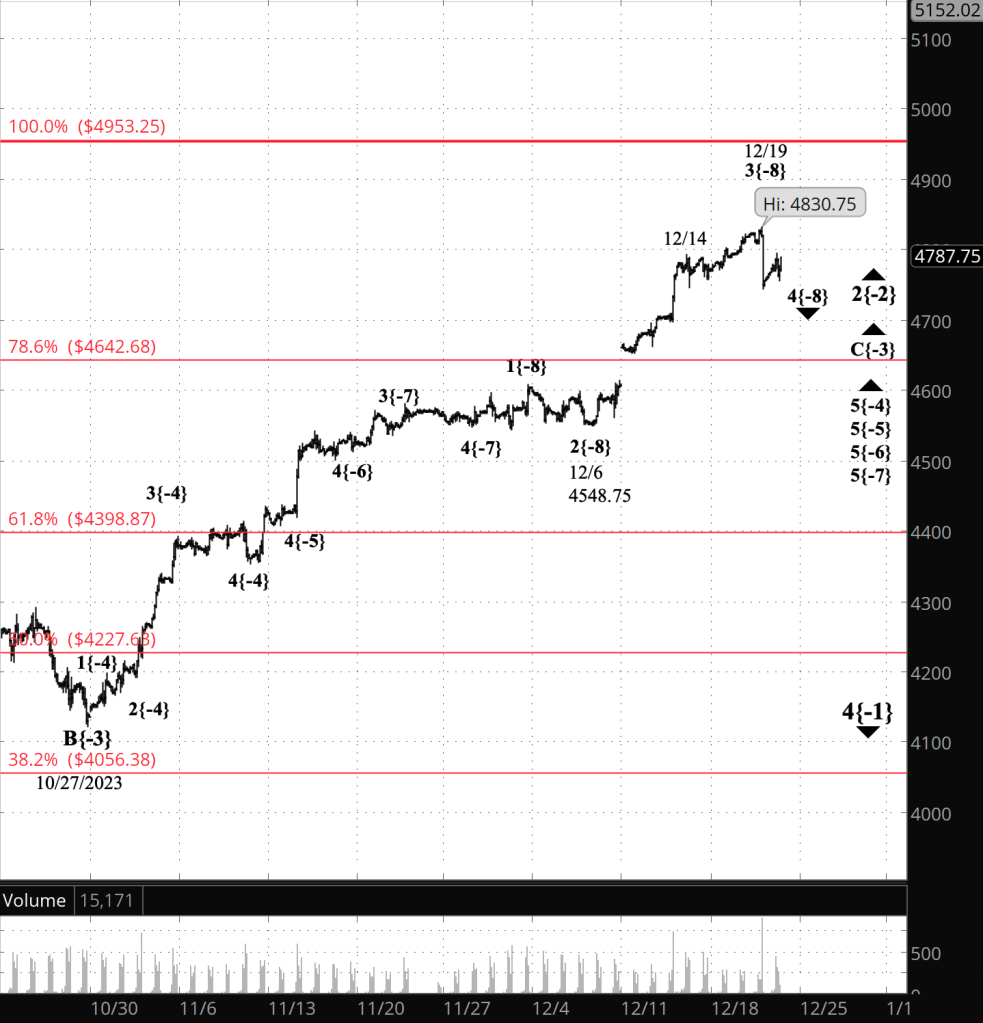
[S&P 500 E-mini futures at 3:30 p.m., 115-minute bars, with volume]
What does Elliott wave theory say? Here are the waves that underly the analyses.
Principal Analysis:
- A downtrend, wave 4{-1}, began on January 4, 2022 and is underway.
- Within wave 4{-1}, an upward correction, wave 2{-2}, began on October 13, 2022.
- The third wave of the correction, wave C{-3}, is underway.
- Wave C{-3} has reached its 5th and final subwave, wave 5{-4} and a series of smaller 5th waves, down to wave 5{-7}.
- Wave 5{-7} internally contains two possiblilities of nearly equal likelihood. Either…
- … the middle subwave, rising wave 3{-8}, is underway, or…
- … the next-to-the-last subwave, a 4{-8}, a downward correction, began with the December 19 high.
- In the afternoon analysis today I switched the 4th wave scenario to the principal analysis slot, and relegated the 3rd wave scenario to alternative status.
Alternative Analysis
- Wave 3{-8} ended on December 14.
- Wave 5{-8}, along with wave C{-3} and possibly wave 2{-2} ended on December 19.
- The present decline is wave 1{-3} within downtrending wave 3{-2}.
We Are Here.
These are the waves currently in progress under my principal analysis. Each line on the list shows the wave number, with the subscript in curly brackets, the traditional degree name, the starting date, the starting price of the S&P 500 E-mini futures, and the direction of the wave.
- S&P 500 Index:
- 5{+3} Supercycle, 7/8/1932, 4.40 (up)
- 5{+2} Cycle, 12/9/1974, 60.96 (up)
- 5{+1} Primary, 3/6/2009, 666.79 (up)
- 5{0} Intermediate, 12/26/2018, 2346.58 (up)
- S&P 500 Futures and index:
- 4{-1} Minor, 1/4/2022, 4953.25 (down) (futures), 4818.62 (down) (index)
- S&P 500 Futures:
- 2{-2} Minute, 10/13/2022, 3491.58 (up)
- C{-3} Minuette, 10/27/2023, 4122.25 (up)
Reading the chart. Price movements — waves – – in Elliott wave analysis are labeled with numbers within trending waves and letters with corrective waves. The subscripts — numbers in curly brackets — designate the wave’s degree, which, in Elliott wave analysis, means the relative position of a wave within the larger and smaller structures that make up the chart. R.N. Elliott, who in the 1930s developed the form of analysis that bears his name, viewed the chart as a complex structure of smaller waves nested within larger waves, which in turn are nested within still larger waves. In mathematics it’s called a fractal structure, where at every scale the pattern is similar to the others.
Learning and other resources. Elliott wave analysis provides context, not prophecy. As the 20th century semanticist Alfred Korzybski put it in his book Science and Sanity (1933), “The map is not the territory … The only usefulness of a map depends on similarity of structure between the empirical world and the map.” And I would add, in the ever-changing markets, we can judge that similarity of structure only after the fact.
See the menu page Analytical Methods for a rundown on where to go for information on Elliott wave analysis.
By Tim Bovee, Portland, Oregon, December 21, 2023
Disclaimer
Tim Bovee, Private Trader tracks the analysis and trades of a private trader for his own accounts. Nothing in this blog constitutes a recommendation to buy or sell stocks, options or any other financial instrument. The only purpose of this blog is to provide education and entertainment.
No trader is ever 100 percent successful in his or her trades. Trading in the stock and option markets is risky and uncertain. Each trader must make trading decisions for his or her own account, and take responsibility for the consequences.
License
All content on Tim Bovee, Private Trader by Timothy K. Bovee is licensed under a Creative Commons Attribution-ShareAlike 4.0 International License.
Based on a work at www.timbovee.com.

You must be logged in to post a comment.