3:30 p.m. New York time
Half an hour before the closing bell. The S&P 500 futures rose during the session, from the 4810s into the 4830s. Wave C within the ongoing 2nd-wave upward correction continues and is in its end game. I’ve udpated the chart.
1:45 p.m. New York time
Trades. I exited my short Iron Condor position on XSP for a 20.9% profit. I entered the position on Friday, December 22, four days before expiration, and held until expiration day today, after the Christmas holiday, making it a 4DTE play. I’ve updated the trade analysis with results.
I entered two new positions, on QQQ and SPY, that will expire the next day, on Wednesday, December 27, making them 1DTE plays. I’ve posted an analysis of the trades.
9:35 a.m. New York time
What’s happening now? The S&P 500 E-mini futures traded narrowly in the low 4800s after trading resumed overnight. The price remained below the December 19 high, 4830.75.
What does it mean? The C wave of a wave-2 upward correction has been underway since October 27 and in its final stages. At play is a small wave four degrees lower than the C wave. Within that small 5th wave, the next-to-the-last subwave, declining wave 4, is now underway.
That 4th wave began on December 19. It will be followed by a rising 5th wave that will complete its low degree parent 5th wave, and a series of 5th wave up to wave C, which will also be complete. Most often with 2nd waves, that C wave will also end the correction. Sometimes a correction will take a compound form, containing two or three corrective patterns. There’s no way to forecast whether a correction will take a simple or complex form. We can only note it when it happens and analyze the chart accordingly.
What are the alternatives? As is often the case with Elliott Wave Theory, there are several ways to analyze the chart.
One possibility is that the wave in play is still a rising 3rd wave. If this is the case, the price will reverse and rise above the December 19 high, 4830.75
It’s also possible to count the low degree wave 3 as having ended on December 14. If that proves to be the case, then the December 19 high was the end of the 5th subwave buried within the C wave of the correction, the correction may have ended along with that C wave, and the decline that followed is the early stage of a downtrending 3rd wave that will carry the price a great deal lower.
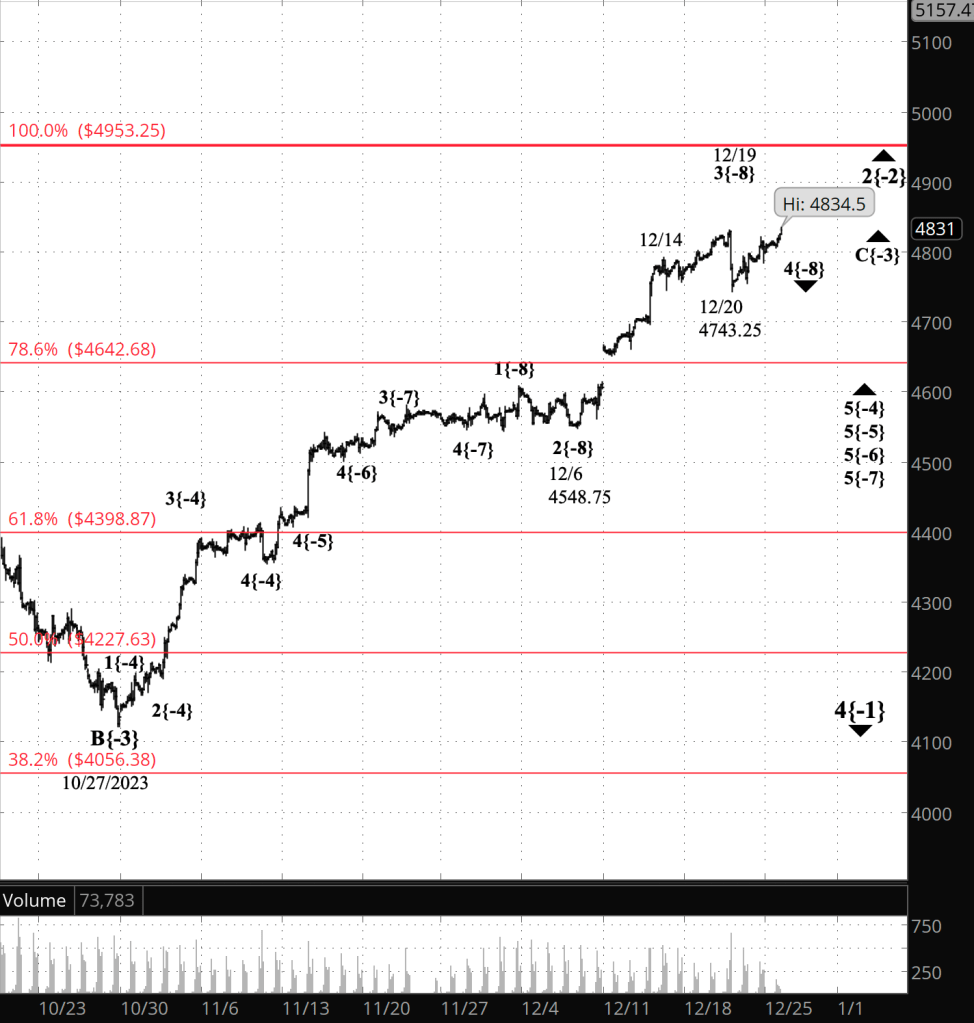
[S&P 500 E-mini futures at 3:30 p.m., 2-hour bars, with volume]
What does Elliott wave theory say? Here are the waves that underlie the analyses.
Principal Analysis:
- A downtrend, wave 4{-1}, began on January 4, 2022 and is underway.
- Within wave 4{-1}, an upward correction, wave 2{-2}, began on October 13, 2022.
- The third wave of the correction, wave C{-3}, is underway.
- Wave C{-3} has reached its 5th and final subwave, wave 5{-4} and a series of smaller 5th waves, down to wave 5{-7}.
- Within wave 5{-7}, the next-to-the-last subwave is underway, wave 4{-8}, a downward correction, began with the December 19 high.
Alternative #1:
- Within wave 5{-7}, the middle subwave, rising wave 3{-8}, is still underway.
Alternative #2:
- Within wave 5{-7}, the final subwave, rising wave 5{-8}, ended on on December 19, also compketing wave C{-3} and most likely ending wave 2{-2}. Downtrending wave wave 3{-2} on December 19 began what will prove to be a robust decline.
We Are Here.
These are the waves currently in progress under my principal analysis. Each line on the list shows the wave number, with the subscript in curly brackets, the traditional degree name, the starting date, the starting price of the S&P 500 E-mini futures, and the direction of the wave.
- S&P 500 Index:
- 5{+3} Supercycle, 7/8/1932, 4.40 (up)
- 5{+2} Cycle, 12/9/1974, 60.96 (up)
- 5{+1} Primary, 3/6/2009, 666.79 (up)
- 5{0} Intermediate, 12/26/2018, 2346.58 (up)
- S&P 500 Futures and index:
- 4{-1} Minor, 1/4/2022, 4953.25 (down) (futures), 4818.62 (down) (index)
- S&P 500 Futures:
- 2{-2} Minute, 10/13/2022, 3491.58 (up)
- C{-3} Minuette, 10/27/2023, 4122.25 (up)
Reading the chart. Price movements — waves – – in Elliott wave analysis are labeled with numbers within trending waves and letters with corrective waves. The subscripts — numbers in curly brackets — designate the wave’s degree, which, in Elliott wave analysis, means the relative position of a wave within the larger and smaller structures that make up the chart. R.N. Elliott, who in the 1930s developed the form of analysis that bears his name, viewed the chart as a complex structure of smaller waves nested within larger waves, which in turn are nested within still larger waves. In mathematics it’s called a fractal structure, where at every scale the pattern is similar to the others.
Learning and other resources. Elliott wave analysis provides context, not prophecy. As the 20th century semanticist Alfred Korzybski put it in his book Science and Sanity (1933), “The map is not the territory … The only usefulness of a map depends on similarity of structure between the empirical world and the map.” And I would add, in the ever-changing markets, we can judge that similarity of structure only after the fact.
See the menu page Analytical Methods for a rundown on where to go for information on Elliott wave analysis.
By Tim Bovee, Portland, Oregon, December 26, 2023
Disclaimer
Tim Bovee, Private Trader tracks the analysis and trades of a private trader for his own accounts. Nothing in this blog constitutes a recommendation to buy or sell stocks, options or any other financial instrument. The only purpose of this blog is to provide education and entertainment.
No trader is ever 100 percent successful in his or her trades. Trading in the stock and option markets is risky and uncertain. Each trader must make trading decisions for his or her own account, and take responsibility for the consequences.
License
All content on Tim Bovee, Private Trader by Timothy K. Bovee is licensed under a Creative Commons Attribution-ShareAlike 4.0 International License.
Based on a work at www.timbovee.com.

[…] the December 26 Trader’s Notebook for a chart showing the prior […]
LikeLike