3:30 p.m. New York time
Half an hour before the closing bell. The S&P 500 futures fell into the 4790s during the session and then rose slightly. The further the price falls, the more likely it is that the 3rd-wave rise that began on December 6 ended at the December 27 high and the declining 4th wave has begun.
Of course, under the pattern I discussed this morning, it’s certainly possible that the price will rise and reach a higher high — above 4841.50 — demonstrating that the rising 3rd wave is still underway.
This is all happening and a lower degree with the third and possibly final subwave, wave C, within the 2nd-wave upward correction that began on October 27.
Wave 3 or wave 4? Time will tell, as the old cliche puts it. Meanwhile, this morning’s analysis is unchanged. I’ve updated the upper chart, showing the C wave.
1:40 p.m. New York time
Trade. I’ve exited my short Iron Fly position on SPY, one day after entry, on expiration day, for an 8.7% profit and have updated the trade analysis with results.
I’ve decided against entering any short-term trades today that expire on Tuesday, after the New Year’s holiday. A study suggests that the first trading day of the year tends to be more volatile than the average. Since the Iron Fly strategy relies on a low-volatility underlying, prudence suggests that I stay away.
9:35 a.m. New York time
Holiday note. Markets will be closed on Monday, New Year’s Day, with no regular sessions. The S&P 500 E-mini futures will resume trading at 6 p.m. New York time on Monday, and the first Trader’s Notebook of 2024 will be posted Tuesday morning at 9:35 a.m. New York time.
What’s happening now? The S&P 500 E-mini futures bounced from the 4840s to the 4820s overnight, remaining within the range established after the December 27 high retreated slightly.
What does it mean? The chart has been stuck in a pattern for more than a week: Reach a new high within the 2nd-wave upward correction that began on October 13, 2022, navigate sideways for a spell, rise a bit more to a new high, repeat. Each new high is possibly the end of the third and final subwave of the long-running corrective pattern, wave C. And the sideways pattern that has followed each high does nothing to answer the question: Is wave C over or not? So the chart remains in a state of constant ambiguity.
However the ambiguity on the chart is resolved, wave C will be the end of the 2nd-wave upward correction if it takes a simple form, containing one corrective pattern. If it takes a complex form, wave C will be followed by a second corrective pattern, and possibly a third, extending the wave 2 correction.
When wave 2 is complete, it will be followed by a powerful 3rd-wave downtrend that will carry the price down the 3490s, and most likely significantly lower.
Meanwhile, wave 2 and its subwaves will break a rule of Elliott Wave Theory if they move above 4953.25, the starting point of the 1st wave that preceded the present 2nd wave. If such a breakout should happen, then the present analysis will be scrapped and a new analysis put in its place, most likely making the decline that began on January 4, 2022 a subwave of a rising 3rd wave that began in December 2022. The 3rd wave is a subwave of an expanding Diagonal Triangle that began in December 2018.
What are the alternatives? When a price movement is close to its end, each new high is potentially the end of the 3rd subwave of low degree and the beginning of 4th subwave. I’ve chosen to mark wave the 3rd subwave as being underway. There’s an equal likelihood that the 4th subwave has begun its decline. In any case, wave 4 will be followed by rising wave 5, which will complete the much larger corrective pattern.
The chart. Two charts today.
The upper chart — the futures — focuses on wave C within the 2nd-wave upward correction, covering October 22 to the present. I’ve superimposed a Fibonacci retracement ladder over the upper chart, in red, showing how close the price has come to the 100% retracement level, which is also the starting point of preceding wave 1, the ceiling on wave 2’s upward movement under the present analysis.
The lower chart — the index — shows the expanding Diagonal Triangle that began in December 2018 in its entirety so far, providing context for the relatively small-scale dramas playing out on the upper chart.
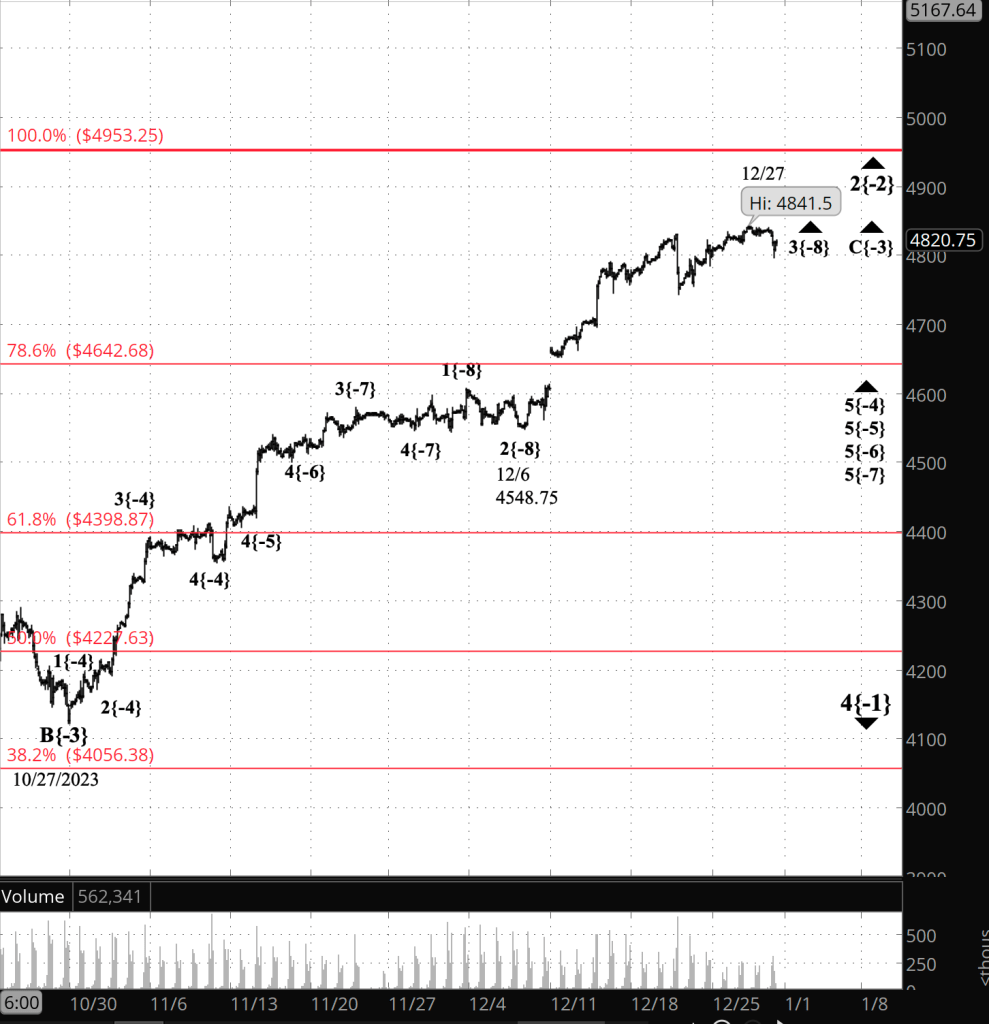
[S&P 500 E-mini futures at 3:30 p.m., 2-hour bars, with volume]
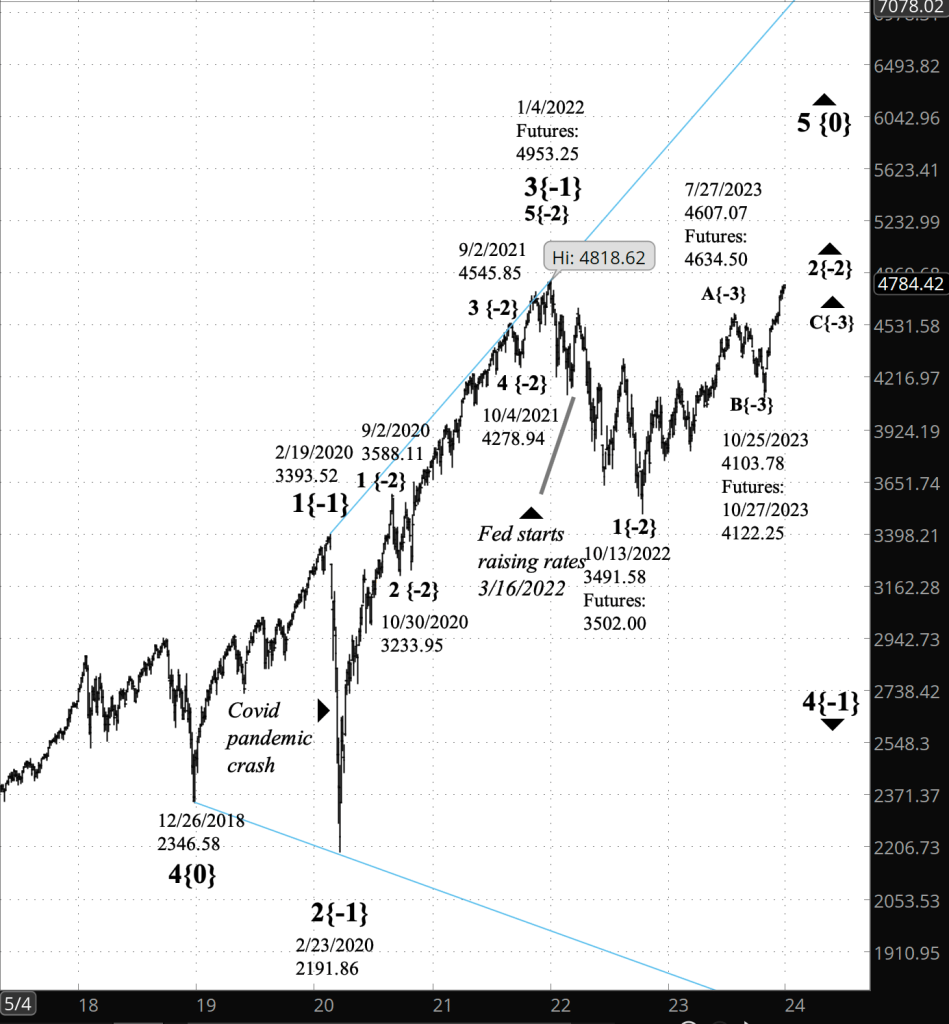
[S&P 500 index at 9:30 a.m., 3-day bars]
What does Elliott wave theory say? Here are the waves that underly the analyses.
Principal Analysis:
- A downtrend, wave 4{-1}, began on January 4, 2022 and is underway.
- Within wave 4{-1}, an upward correction, wave 2{-2}, began on October 13, 2022.
- The third wave of the correction, wave C{-3}, is underway.
- Wave C{-3} has reached its 5th and final subwave, wave 5{-4} and a series of smaller 5th waves, down to wave 5{-7}.
- Within wave 5{-7}, the middle subwave is underway, wave 3{-8}, an uptrend, began with the December 6 low.
Alternative Analysis:
- Within wave 5{-7}, the next-to-the-last subwave is underway, wave 4{-8}, a downward correction, began with the December 27 high.
We Are Here.
These are the waves currently in progress under my principal analysis. Each line on the list shows the wave number, with the subscript in curly brackets, the traditional degree name, the starting date, the starting price of the S&P 500 E-mini futures, and the direction of the wave.
- S&P 500 Index:
- 5{+3} Supercycle, 7/8/1932, 4.40 (up)
- 5{+2} Cycle, 12/9/1974, 60.96 (up)
- 5{+1} Primary, 3/6/2009, 666.79 (up)
- 5{0} Intermediate, 12/26/2018, 2346.58 (up)
- S&P 500 Futures and index:
- 4{-1} Minor, 1/4/2022, 4953.25 (down) (futures), 4818.62 (down) (index)
- S&P 500 Futures:
- 2{-2} Minute, 10/13/2022, 3491.58 (up)
- C{-3} Minuette, 10/27/2023, 4122.25 (up)
Reading the chart. Price movements — waves – – in Elliott wave analysis are labeled with numbers within trending waves and letters with corrective waves. The subscripts — numbers in curly brackets — designate the wave’s degree, which, in Elliott wave analysis, means the relative position of a wave within the larger and smaller structures that make up the chart. R.N. Elliott, who in the 1930s developed the form of analysis that bears his name, viewed the chart as a complex structure of smaller waves nested within larger waves, which in turn are nested within still larger waves. In mathematics it’s called a fractal structure, where at every scale the pattern is similar to the others.
Learning and other resources. Elliott wave analysis provides context, not prophecy. As the 20th century semanticist Alfred Korzybski put it in his book Science and Sanity (1933), “The map is not the territory … The only usefulness of a map depends on similarity of structure between the empirical world and the map.” And I would add, in the ever-changing markets, we can judge that similarity of structure only after the fact.
See the menu page Analytical Methods for a rundown on where to go for information on Elliott wave analysis.
By Tim Bovee, Portland, Oregon, December 29, 2023
Disclaimer
Tim Bovee, Private Trader tracks the analysis and trades of a private trader for his own accounts. Nothing in this blog constitutes a recommendation to buy or sell stocks, options or any other financial instrument. The only purpose of this blog is to provide education and entertainment.
No trader is ever 100 percent successful in his or her trades. Trading in the stock and option markets is risky and uncertain. Each trader must make trading decisions for his or her own account, and take responsibility for the consequences.
License
All content on Tim Bovee, Private Trader by Timothy K. Bovee is licensed under a Creative Commons Attribution-ShareAlike 4.0 International License.
Based on a work at www.timbovee.com.

You must be logged in to post a comment.