3:30 p.m. New York time
Half an hour before the closing bell. The S&P 500 futures fluctuated between the 4730s and the 4760s during the session, in a small upward correction deep within a much larger 3rd wave downtrend that began on January 2.
This morning’s analysis stands unchanged. I’ve updated the upper chart, a close-up of the futures, and have left the lower chart, a long-term view of the index back to 2018, as it was this morning.
1:30 p.m. New York time
Trades. I exited my short Iron Condor position on IWM, 15 days after entry and 22 before expiration, for an 11.6% loss admid a geeneral market decline since trading resumed for the new year. I’ve updated the trade analysis with results.
9:35 a.m. New York time
What’s happening now? The S&P 500 E-mini futures moved largely sideways in overnight trading, drifting lower as the clock ticked toward the opening bell.
What does it mean? The decline brought the price below the target range of the downward 4th wave of small degree within the upward correction that began on October 13, 2022. The 4th wave is five levels deep within wave 2. All of the waves in between are in their final stages, so what that deeply buried small wave does will determine whether the correction is over or not.
I said yesterday that a decline below the target range would trigger a reassessment of the analysis. The time spent below the range was brief — only a few minutes — and I was tempted to delay the relabeling of the chart until the decline has greater staying power. Nonetheless, the decline has formed five waves to the downside, suggesting a trend rather than a correction.
The new principal analysis: Wave 2 is complete and downtrending wave 3 has begun and is in its early stages. It will eventually carry the price below the start of the preceding 1st wave, 3502 on the futures, and almost certainly significantly below that level.
Could this declaration be premature? It certainly could, and if that proves to be the case, then I’ll return the chart to its January 3 version.
What are the alternatives? It’s possible that wave 2{-2} will take a compound form, containing two or three corrective patterns. if that proves to be the case, then the present declining is an X wave, separating the first corrective pattern, which ended overnight, from the second corrective pattern.
The Charts. The upper chart shows the final subwave of the wave 2 correction and the start of the wave 3 downtrend on the S&P 500 futures. The lower chart shows the entirety of the expanding Diagonal Triangle that began in December 2018 and contains the wave 2 upward correction.
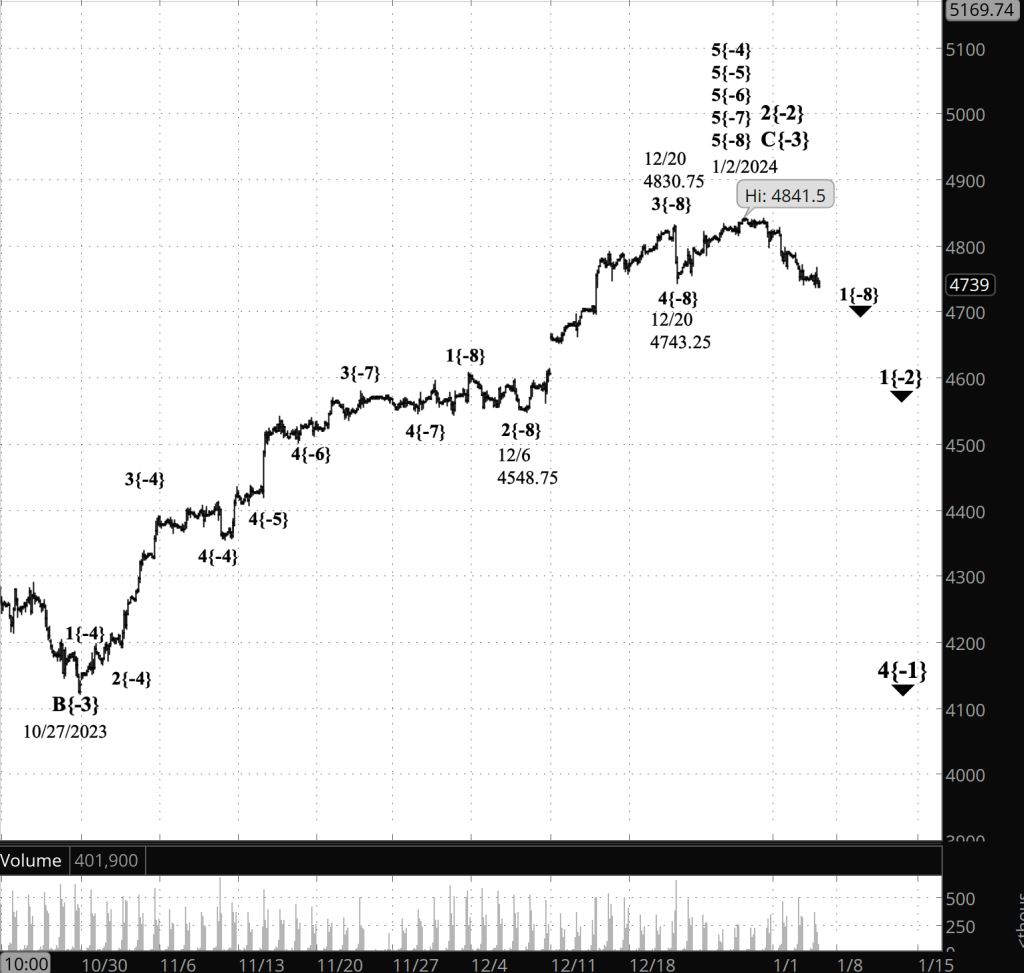
[S&P 500 E-mini futures at 3:30 p.m. , 2-hour bars, with volume]
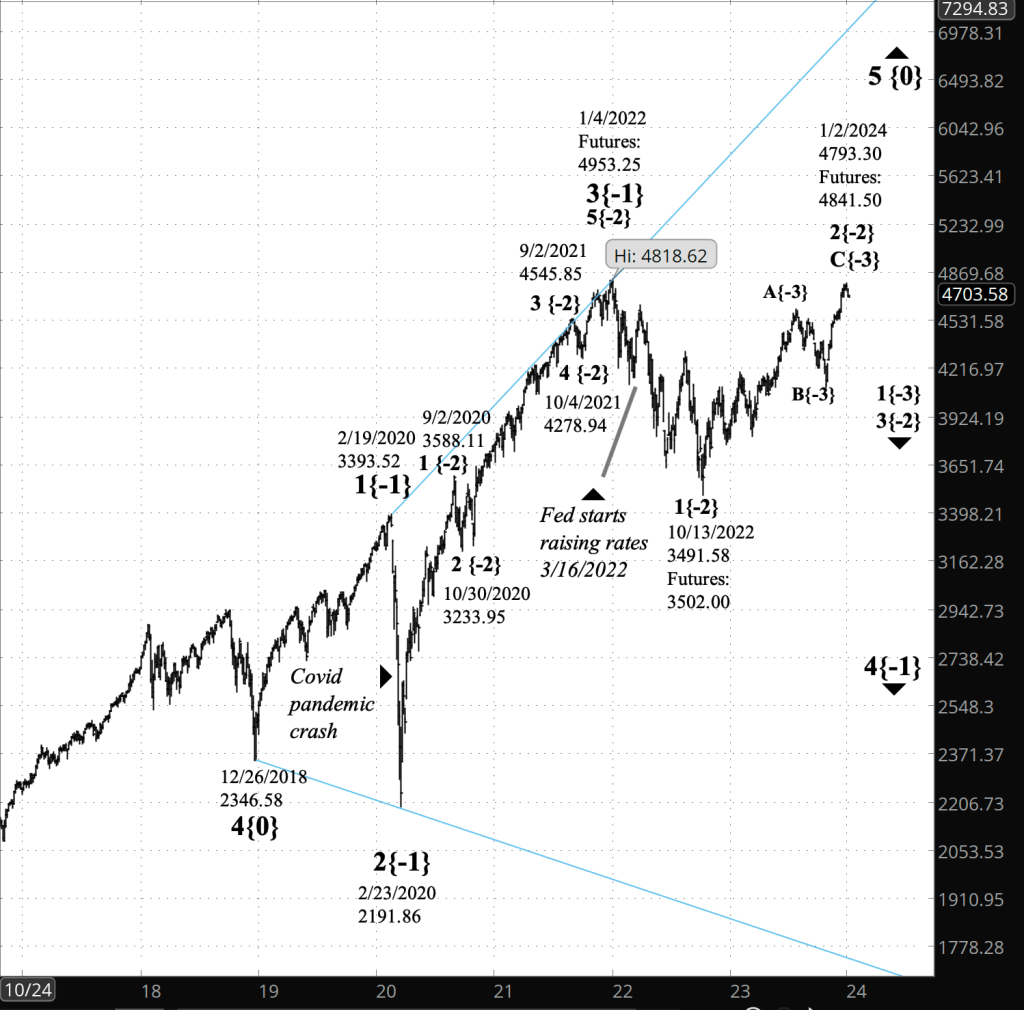
[S&P 500 index at 9:34 a.m., 3-day bars]
What does Elliott wave theory say? Here are the waves that underly the analyses.
Principal Analysis:
- A downtrend, wave 4{-1}, began on January 4, 2022 and is underway.
- Within wave 4{-1}, an upward correction, wave 3{-2}, began on January 2, 2024 and is in wave 1{-3}, the first of five subwaves.
Alternative Analysis:
- Wave 2{-2} is still underway and is taking a compound form.
- The first corrective pattern ended on January 2, the end of wave C{-3}.
- A declining connector wave is underway, wave X{-3}.
We Are Here.
These are the waves currently in progress under my principal analysis. Each line on the list shows the wave number, with the subscript in curly brackets, the traditional degree name, the starting date, the starting price of the S&P 500 E-mini futures, and the direction of the wave.
- S&P 500 Index:
- 5{+3} Supercycle, 7/8/1932, 4.40 (up)
- 5{+2} Cycle, 12/9/1974, 60.96 (up)
- 5{+1} Primary, 3/6/2009, 666.79 (up)
- 5{0} Intermediate, 12/26/2018, 2346.58 (up)
- S&P 500 Futures and index:
- 4{-1} Minor, 1/4/2022, 4953.25 (down) (futures), 4818.62 (down) (index)
- S&P 500 Futures:
- 3{-2} Minute, 1/2/2024, 4841.50 (down)
- 1{-3} Minuette, 1/2/2024, 4841.50 (down)
Reading the chart. Price movements — waves – – in Elliott wave analysis are labeled with numbers within trending waves and letters with corrective waves. The subscripts — numbers in curly brackets — designate the wave’s degree, which, in Elliott wave analysis, means the relative position of a wave within the larger and smaller structures that make up the chart. R.N. Elliott, who in the 1930s developed the form of analysis that bears his name, viewed the chart as a complex structure of smaller waves nested within larger waves, which in turn are nested within still larger waves. In mathematics it’s called a fractal structure, where at every scale the pattern is similar to the others.
Learning and other resources. Elliott wave analysis provides context, not prophecy. As the 20th century semanticist Alfred Korzybski put it in his book Science and Sanity (1933), “The map is not the territory … The only usefulness of a map depends on similarity of structure between the empirical world and the map.” And I would add, in the ever-changing markets, we can judge that similarity of structure only after the fact.
See the menu page Analytical Methods for a rundown on where to go for information on Elliott wave analysis.
By Tim Bovee, Portland, Oregon, January 4, 2024
Disclaimer
Tim Bovee, Private Trader tracks the analysis and trades of a private trader for his own accounts. Nothing in this blog constitutes a recommendation to buy or sell stocks, options or any other financial instrument. The only purpose of this blog is to provide education and entertainment.
No trader is ever 100 percent successful in his or her trades. Trading in the stock and option markets is risky and uncertain. Each trader must make trading decisions for his or her own account, and take responsibility for the consequences.
License
All content on Tim Bovee, Private Trader by Timothy K. Bovee is licensed under a Creative Commons Attribution-ShareAlike 4.0 International License.
Based on a work at www.timbovee.com.

You must be logged in to post a comment.