3:30 p.m. New York time
Half an hour before the closing bell. The S&P 500 futures swung into a small upward correction during the session as the wave 3 downtrend that began on December 27, 2023 continued to work through its early stages.
Elliott Wave Theory defines two sorts of correction that are most common, each with three subwaves, A, B, and C: A Zigzag has five subwaves in the A wave, three in the B and five in the C. A Flat has three subwaves in A and also in B, and five subwaves in C. My experience has been that 2nd waves are more likely to take the Zigzag pattern, and 4th waves, the Flat. An alternation rule of Elliott Wave Theory is that if the wave 2 correction is of one pattern, wave 4 will be the other pattern.
All of this is happening within wave 3{-2} on the chart, a subwave of a larger declining wave 4{-1}, the next to the last wave of the expanding Diagonal Triangle that began in late 2018.
The first subwave, downtrending wave 1{-2}, took 282 days to reach completions, and the second subwave, upward correction 2{-2}, took 440 days. A 3rd wave is almost always longer than waves 1 and 2 by a large margin, so we can rest assured that the downtrending 3rd wave, with all of its internal ups and downs, will be with us for quite a long time.
I made two adjustments to the charts. I the upper chart, I’ve moved the end point label of wave 1{-8}. On the lower chart, I corrected the date of the wave 2{-2} end point.
1:45 p.m. New York time
Trades. I’ve entered a short Iron Fly position on XSP that expires on Monday, with the intent of selling shortly after the opening bell, and have posted an analysis of the trade.
Trades will be blocked on two days next week because of economic reports: On Wednesday by the Consumer Price Index before the opening bell on Thursday, and on Thursday by the Producer Price Index on Friday.
I’ll consider entering short-term Iron Condor options positions covering earnings announcements next week: ACI on Monday for a pre-opening Tuesday announcement, and DAL on Thursday in anticipation of a Friday announcement before the opening. Whether actually take the trade or not depends upon whether the options maintain their high implied volatility and whether their pricing will provide sufficient return.
9:35 a.m. New York time
What’s happening now? The S&P 500 E-mini futures declined overnight, reaching a low of 4702 as the December employment statistics were released and then rising back into the 4720s.
What does it mean? The 3rd-wave downtrend that began on December 27, 2023 continues and is in its early stages. In Elliott Wave Theory, when a wave has first begun, determining the degree of the subwaves — where they reside in the fractal structure of the movement — is little better than a guess. I’ve chosen to label the waves as being six degrees lower than the 3rd wave that encompasses them.
That degree — {-8} on the chart — seems similar in size and duration to {-8} waves within the preceding 2nd wave upward correction, so I’ll go with that labeling for now. That degree could be modified as the the 1st subwave — wave 1{-3} — within the downtrend — wave 3{-2} — progresses.
Under the Elliott Wave Theory’s analytical rules, a 3rd wave trend always moves beyond the starting point of the preceding 2nd wave. That means the present 3rd wave, at a minimum, will move below 3502, where wave 2{-2} began on October 13, 2022.
A 3rd wave almost always moves far below the starting point of wave 2.
The parent of wave 3{-2} is wave 4{-1}, the declining next-to-the-last wave of a very large expanding Diagonal Triangle that began on December 26, 2018. A characteristic of expanding triangles is, at the extremes, the highs keep moving higher and the lows, lower. Wave 4{-1} will eventually come close to or meet the lower boundary of the triangle’s price channel, which is presently in the 1750s and declining further every session.
What are the alternatives? None at present. Without a doubt, they will develop.
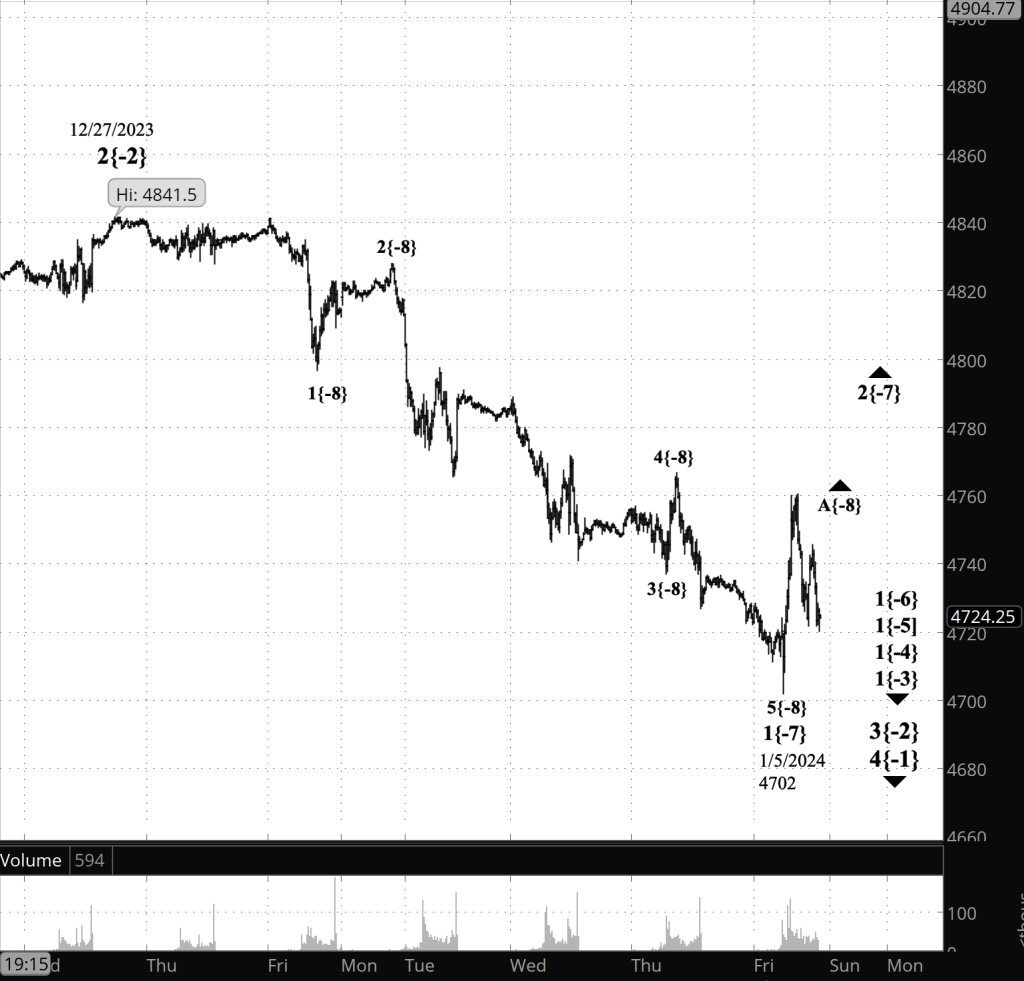
Charts. The upper chart, tracking the futures, shows a close-up of the downtrending 3rd wave that began on December 27. The lower chart, tracking the index, shows the expanding Diagonal Triangle, with the upper and lower price channels drawn in red.

[S&P 500 E-mini futures at 3:30 p.m., 15-minute bars, with volume]
[S&P 500 index at 3:29 p.m., 13-day bars]
What does Elliott wave theory say? Here are the waves that underly the analyses.
Principal Analysis:
- A downtrend, wave 4{-1}, began on January 4, 2022 and is underway.
- Within wave 4{-1}, a downtrend, wave 3{-2}, began on January 2, 2024 and is in wave 1{-3}, the first of five subwaves.
- Deep within that downtrend’s 1st wave, downtrending wave 5{-8} and its parent, wave 1{-7}, ended at the overnight low, 4702. Wave 2{-7} is now underway, an upward correction of low degree, and within it, wave A{-8} is underway.
We Are Here.
These are the waves currently in progress under my principal analysis. Each line on the list shows the wave number, with the subscript in curly brackets, the traditional degree name, the starting date, the starting price of the S&P 500 E-mini futures, and the direction of the wave.
- S&P 500 Index:
- 5{+3} Supercycle, 7/8/1932, 4.40 (up)
- 5{+2} Cycle, 12/9/1974, 60.96 (up)
- 5{+1} Primary, 3/6/2009, 666.79 (up)
- 5{0} Intermediate, 12/26/2018, 2346.58 (up)
- S&P 500 Futures and index:
- 4{-1} Minor, 1/4/2022, 4953.25 (down) (futures), 4818.62 (down) (index)
- S&P 500 Futures:
- 3{-2} Minute, 12/27/2022, 3491.58 (down)
- 1{-3} Minuette, 12/27/2022, 3491.58 (down)
Reading the chart. Price movements — waves – – in Elliott wave analysis are labeled with numbers within trending waves and letters with corrective waves. The subscripts — numbers in curly brackets — designate the wave’s degree, which, in Elliott wave analysis, means the relative position of a wave within the larger and smaller structures that make up the chart. R.N. Elliott, who in the 1930s developed the form of analysis that bears his name, viewed the chart as a complex structure of smaller waves nested within larger waves, which in turn are nested within still larger waves. In mathematics it’s called a fractal structure, where at every scale the pattern is similar to the others.
Learning and other resources. Elliott wave analysis provides context, not prophecy. As the 20th century semanticist Alfred Korzybski put it in his book Science and Sanity (1933), “The map is not the territory … The only usefulness of a map depends on similarity of structure between the empirical world and the map.” And I would add, in the ever-changing markets, we can judge that similarity of structure only after the fact.
See the menu page Analytical Methods for a rundown on where to go for information on Elliott wave analysis.
By Tim Bovee, Portland, Oregon, January 5, 2024
Disclaimer
Tim Bovee, Private Trader tracks the analysis and trades of a private trader for his own accounts. Nothing in this blog constitutes a recommendation to buy or sell stocks, options or any other financial instrument. The only purpose of this blog is to provide education and entertainment.
No trader is ever 100 percent successful in his or her trades. Trading in the stock and option markets is risky and uncertain. Each trader must make trading decisions for his or her own account, and take responsibility for the consequences.
License
All content on Tim Bovee, Private Trader by Timothy K. Bovee is licensed under a Creative Commons Attribution-ShareAlike 4.0 International License.
Based on a work at www.timbovee.com.

You must be logged in to post a comment.