3:30 p.m. New York time
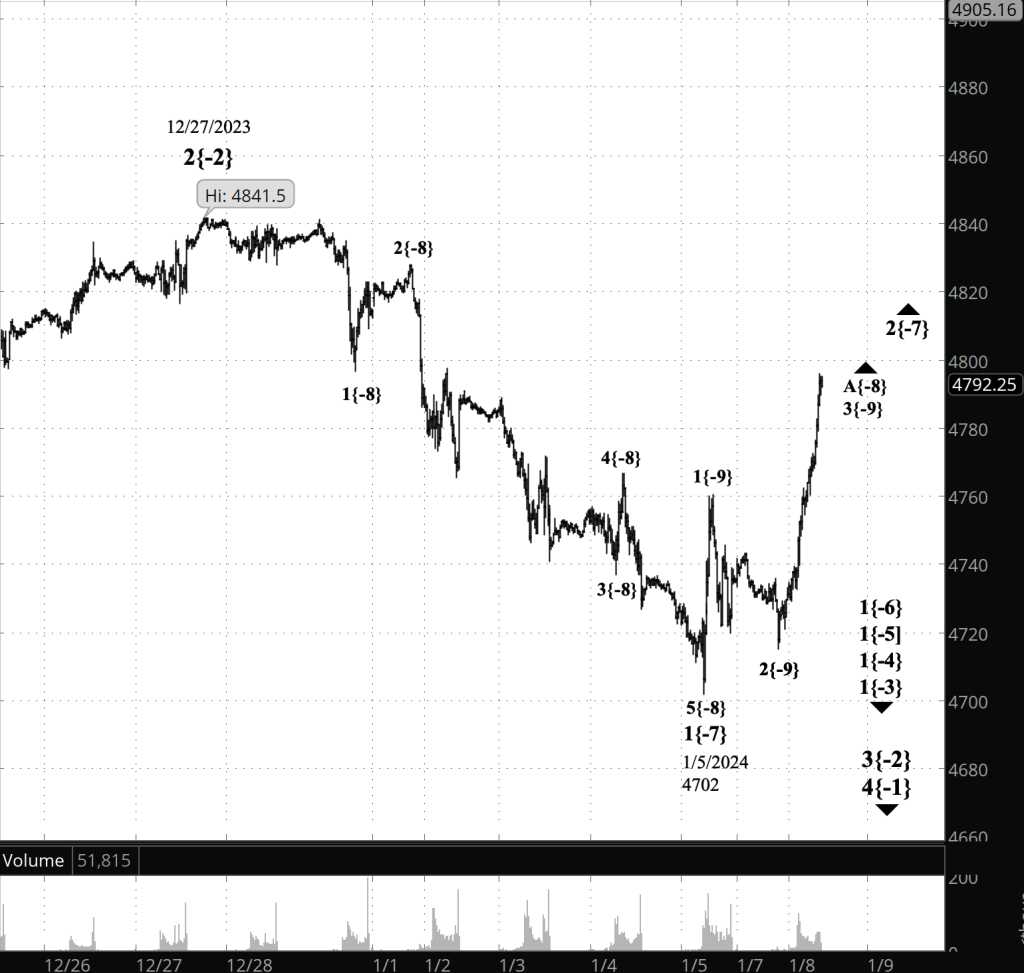
Half an hour before the closing bell. The S&P 500 futures continued rising during the session, with the first subwave — wave A — of the ongoing 2nd-wave downward correction reaching into the 4790s.
It is most common in 2nd waves for the A wave to take the Zigzag form, with five subwaves. I count wave A as being in its middle subwave, wave 3.
I’ve updated the chart.
2:10 a.m. New York time
Trades. I exited my short Iron Fly options position on XSP, which I entered on Friday and held over the weekend, for a 41.8% profit and updated the trade analysis with results.
I entered two options positions today.
My short Iron Fly on SPY is an overnighter. I’ll exit Tuesday morning right after the opening bell.
My short Iron Condor on USO is a longer-term position with a 50% profit target. It expires 39 days after entry, on February 16, and if needed I’ll manage the position 21 days before expiration, on January 26.
I’ve posted trade analyses for both the SPY and USO positions.
I worked on entering a short Iron Condor position on ACI, timed to coincide with Tuesday’s earnings announcement before the opening bell. But it’s a lower priced underlying stock — less than $30 — and I couldn’t work out a structure that would meet my requirements and still produce sufficient return to be worthwhile. The next earnings-trade opportunity is DAL: Entry on January 11 and announcement on January 12 before the session begins.
9:35 a.m. New York time
What’s happening now? The S&P 500 E-mini futures declined after trading resumed overnight, reaching into the 4710s and then reversing as the opening bell approached, returning to the 4740s.
What does it mean? A 2nd-wave upward correction deep within a much larger 3rd-wave downtrend is now underway. Elliott Wave Theory has a rule that applies to each 2nd wave: It never moves above the starting point of the preceding 1st wave. In this case, the 1st wave began on December 27, coincident with the start of a downtrending 3rd wave five degree larger in the fractal structure the price movements.
That starting point, 4841.50, is a non-negotiable barrier to the 2nd wave’s rise. Bottom line: The correction has a long distance to travel.
There’s no formal guidance on how much of the 1st wave will be retraced by the 2nd wave. My experience is that wave 2 usually retraces most of wave 1 and results in much happy talk concluding that the market’s uptrend has resumed, expectations that are eventually dashed.
The much larger parent wave of the 2nd-wave correction — wave 3 — will ultimately reach below the endpoint of the preceding 1st wave of the same degree — 3491.38. Typically a 3rd wave will move significantly below that endpoint.
What are the alternatives? There are two:
Alternative #1: The 2nd wave rise that preceded the 3rd wave is still underway and is taking a compound form. The present decline is an X wave, which will link the first corrective pattern within wave 2 to a second corrective pattern. A compound correction contains up to three corrective patterns.
Alternative #2: This is more of a general observation. Assigning a degree to subwaves early in a correction is, frankly, little more than an educated guess. The only guidance is that the time and distance characteristics of a subwave be similar to those attributes in waves of the same degree that came before. Not exactly a precise metric. So the degrees I’ve assigned may change over time as the downtrend progresses. The degrees on the chart labels are subscripts within curly brackets that follow the wave number. The degree number shows the wave’s position relative to wave 5{0}, an expanding Diagonal Triangle still underway that began on December 26, 2018. Wave 2{-7}, the present upward correction, is seven degrees lower than wave 5{0}.
[S&P 500 E-mini futures at 3:30 p.m., 20-minute bars, with volume]
What does Elliott wave theory say? Here are the waves that underly the analyses.
Principal Analysis:
- Wave 5{0}, an expanding Diagonal Triangle, began on December 26, 2018.
- Within it, a downtrend, wave 4{-1}, began on January 4, 2022 and is underway.
- Wave 4{-1} is the parent wave of a downtrend, wave 3{-2}, that began on January 2, 2024 and is in wave 1{-3}, the first of five subwaves.
- Deep within that downtrend’s 1st wave, downtrending wave 5{-8} and its parent, wave 1{-7}, ended at the overnight low, 4702. Wave 2{-7} is now underway, an upward correction of low degree, and within it, wave A{-8} is underway.
Alternative #1:
- Wave 2{-2}, an upward correction that began on October 13, 2022, continues and is taking a compound form.
- Wave X{-3} is underway, connecting the now complete first corrective pattern and the not-yet-begun second corrective pattern.
Alternative #2:
- The upward correction that began on January 5, labeled on the chart was wave 2{-7}, is actually wave 2{-6}, or perhaps wave 2{-5}, or maybe even larger.
We Are Here.
These are the waves currently in progress under my principal analysis. Each line on the list shows the wave number, with the subscript in curly brackets, the traditional degree name, the starting date, the starting price of the S&P 500 E-mini futures, and the direction of the wave.
- S&P 500 Index:
- 5{+3} Supercycle, 7/8/1932, 4.40 (up)
- 5{+2} Cycle, 12/9/1974, 60.96 (up)
- 5{+1} Primary, 3/6/2009, 666.79 (up)
- 5{0} Intermediate, 12/26/2018, 2346.58 (up)
- S&P 500 Futures and index:
- 4{-1} Minor, 1/4/2022, 4953.25 (down) (futures), 4818.62 (down) (index)
- S&P 500 Futures:
- 2{-2} Minute, 10/13/2022, 3491.58 (up)
- C{-3} Minuette, 10/27/2023, 4122.25 (up)
Reading the chart. Price movements — waves – – in Elliott wave analysis are labeled with numbers within trending waves and letters with corrective waves. The subscripts — numbers in curly brackets — designate the wave’s degree, which, in Elliott wave analysis, means the relative position of a wave within the larger and smaller structures that make up the chart. R.N. Elliott, who in the 1930s developed the form of analysis that bears his name, viewed the chart as a complex structure of smaller waves nested within larger waves, which in turn are nested within still larger waves. In mathematics it’s called a fractal structure, where at every scale the pattern is similar to the others.
Learning and other resources. Elliott wave analysis provides context, not prophecy. As the 20th century semanticist Alfred Korzybski put it in his book Science and Sanity (1933), “The map is not the territory … The only usefulness of a map depends on similarity of structure between the empirical world and the map.” And I would add, in the ever-changing markets, we can judge that similarity of structure only after the fact.
See the menu page Analytical Methods for a rundown on where to go for information on Elliott wave analysis.
By Tim Bovee, Portland, Oregon, January 8, 2024
Disclaimer
Tim Bovee, Private Trader tracks the analysis and trades of a private trader for his own accounts. Nothing in this blog constitutes a recommendation to buy or sell stocks, options or any other financial instrument. The only purpose of this blog is to provide education and entertainment.
No trader is ever 100 percent successful in his or her trades. Trading in the stock and option markets is risky and uncertain. Each trader must make trading decisions for his or her own account, and take responsibility for the consequences.
License
All content on Tim Bovee, Private Trader by Timothy K. Bovee is licensed under a Creative Commons Attribution-ShareAlike 4.0 International License.
Based on a work at www.timbovee.com.

You must be logged in to post a comment.